
Figure 2. Representative double fluorescent in situ hybridisation data for three combinations of pair-rule genes.
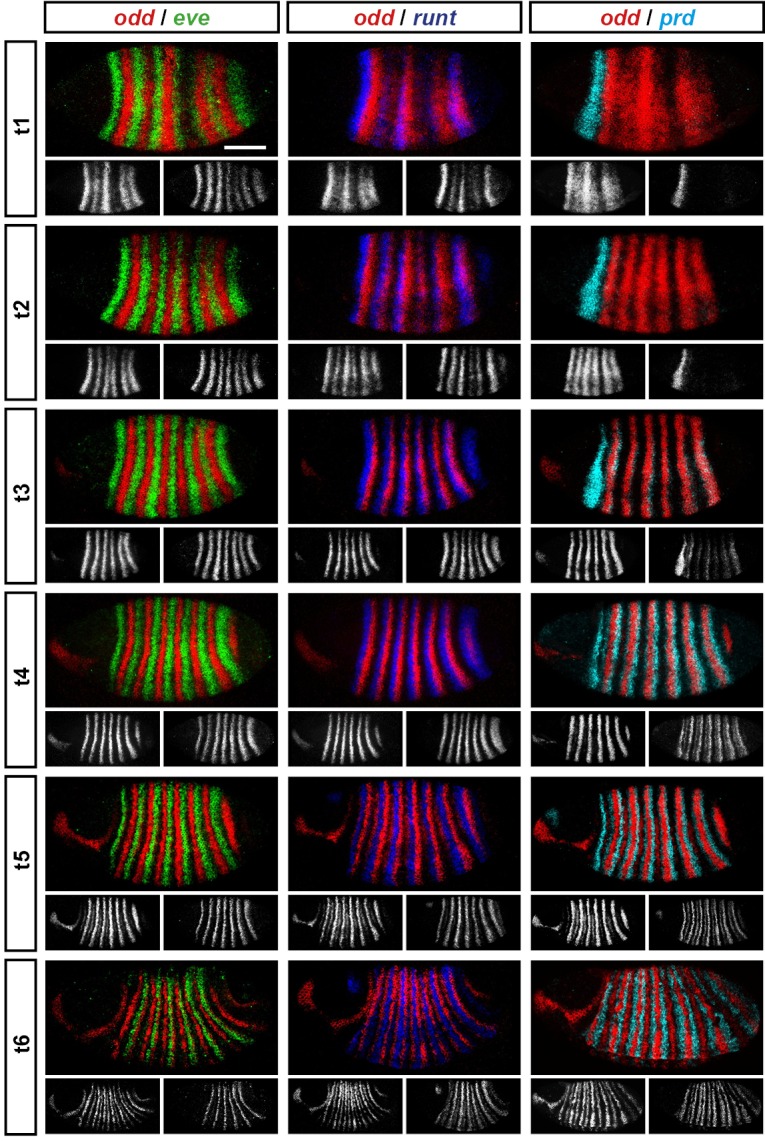
This figure shows a small subset of our wild-type dataset. Each column represents a different pairwise combination of in situ probes, while each row shows similarly-staged embryos of increasing developmental age. All panels show a lateral view, anterior left, dorsal top. Individual channels are shown in grayscale below each double-channel image. For ease of comparison, the signal from each gene is shown in a different colour in the double-channel images. Time classes are arbitrary, meant only to illustrate the progressive stages of pattern maturation between early cellularisation (t1) and late gastrulation (t6). Note that the developing pattern of odd expression in the head provides a distinctive and reliable indicator of embryo age. Scale bar = 100 μm. The complete dataset is available from the Dryad Digital Repository (Clark and Akam, 2016).