
Figure 6. Schematic diagram of the transition to single-segment periodicity.
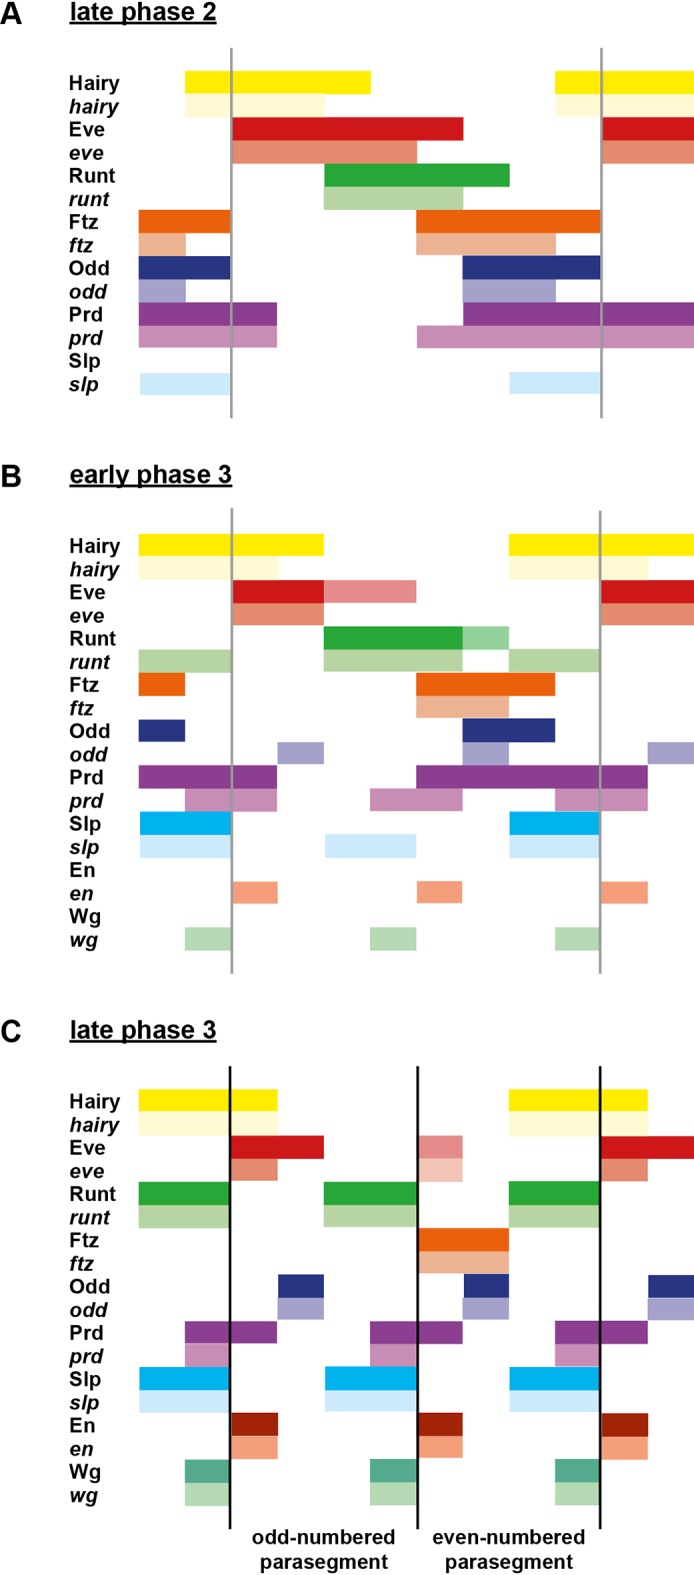
Schematic diagram showing segmentation gene expression at late phase 2 (A), early phase 3 (B) and late phase 3 (C). The horizontal axis represents an idealised portion of the AP axis (~12 nuclei across). The grey vertical lines in (A,B) demarcate a double parasegment repeat (~8 nuclei across), while black lines in (C) indicate future parasegment boundaries. The patterns of protein expression (intense colours) and transcript expression (paler colours) of the pair-rule genes are shown at each timepoint. Those of the segment-polarity genes en and wg are additionally shown at the later timepoints. Transcript distributions were inferred from our double in situ data, while pair-rule protein distributions were inferred mainly from triple antibody stains in the FlyEx database (Pisarev et al., 2009). Additional protein expression information for late phase 3 (equivalent to the onset of germband extension) was gathered from published descriptions (Frasch et al., 1987; DiNardo et al., 1985; van den Heuvel et al., 1989; Gutjahr et al., 1993; Lawrence and Johnston, 1989; Carroll et al., 1988). Fading expression of Eve and Runt is represented by lighter red and green sections in (B). The transient 'minor' stripes of Eve are represented by faint red in (C). Note that this diagram does not capture the graded nature of pair-rule protein distributions during cellularisation.