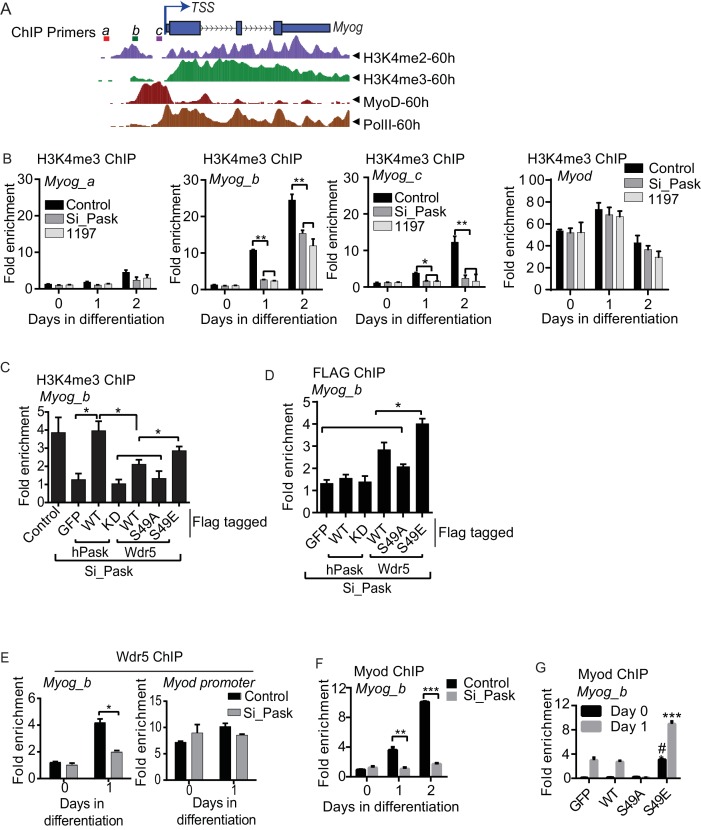
Figure 6. Pask is required for recruitment of Wdr5 and MyoD to the Myog promoter during differentiation.
(A) A depiction of the Myog genomic locus depicting MyoD and RNAPolII occupancy as well as H3K4me2 and H3K4me3 abundance at 60 hr of differentiation from the ENCODE dataset for the C2C12 cell line. TSS: Transcription Start Site. Colored horizontal bars indicate the positions of ChIP amplicons a, b or c. (B) Fold H3K4me3 enrichment in control, Pask-siRNA or BioE-1197-treated C2C12 cells was assessed by ChIP-qPCR of the indicated amplicon followed by normalization against H3K4me3-deficient negative control region of the actb gene. n = 3. Error bars ± S.D. *p<0.05, **p<0.005. Because the b amplicon showed the most significant enrichment of H3K4me3 in control samples, it was selected for future studies. (C) H3K4me3 ChIP was performed from control or Pask silenced C2C12 cells expressing GFP, WT or KD Pask or WT, S49A or S49E Wdr5 at Day 1 of differentiation. n = 3. Error bars ± S.D. *p<0.05. (D) Flag ChIP was performed from Pask silenced C2C12 cells expressing GFP, WT or KD Pask or WT, S49A or S49E Wdr5 at Day 1 of differentiation. n = 3. Error bars ± S.D. *p<0.05. (E) Endogenous Wdr5 ChIP was performed from control or Pask-siRNA C2C12 cells at Day 0 or Day 1 of differentiation and fold enrichment on the Myog promoter was determined by qRT-PCR. Error bars ± S.D. *p<0.05. (F) MyoD ChIP was performed from control or Pask-siRNA C2C12 cells at Day 0, Day 1 or Day 2 of differentiation and fold enrichment of MyoD occupancy on the Myog promoter was determined by qRT-PCR. n = 3. Error bars ± S.D. **p<0.05, ***p<0.0005. (G) MyoD ChIP was performed from proliferating (Day 0) or differentiating (Day 1) C2C12 cells expressing GFP, Wdr5WT, Wdr5S49A or Wdr5S49E. n = 3. Error bars ± S.D. #, ***p<0.0005, Wdr5 S49E vs GFP, Wdr5WT or Wdr5S49A at Day 0 and Day 1 respectively.
DOI: http://dx.doi.org/10.7554/eLife.17985.021

