. 2016 Sep 23;5:e17985. doi: 10.7554/eLife.17985

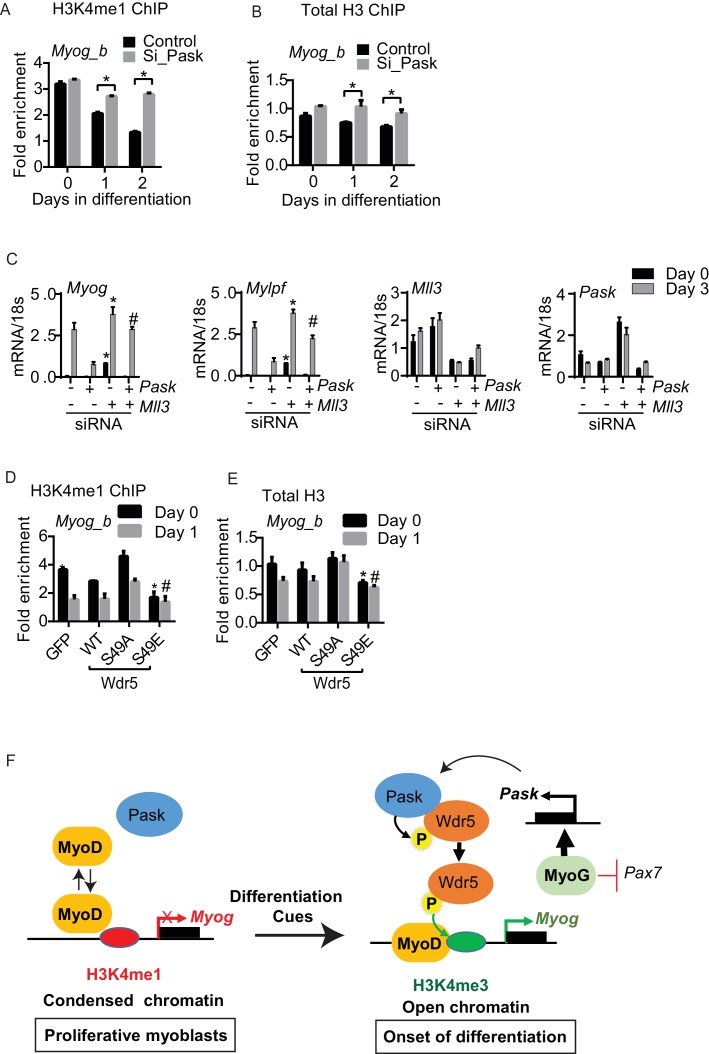
Figure 7. Differentiation induced H3K4me1 to H3K4me3 conversion is dependent upon Pask phosphorylation of Wdr5.

(A) H3K4me1 and (B) total H3 ChIP were performed from control or Pask-siRNA C2C12 cells at the indicated day of differentiation and fold enrichment on the Myog promoter was determined by qRT-PCR using primer set b. Error bars ± S.D. *p<0.05, **p<0.005. (C) The differentiation potential of C2C12 myoblasts subjected to Pask or Mll3 siRNA treatments was assessed by qRT-PCR using primers specific for Myog, Mylpf, Mll3 and Pask. (D) H3K4me1 or (E) total H3 ChIP was performed from proliferating (Day 0) or differentiating (Day 1) C2C12 cells expressing GFP, Wdr5WT, Wdr5S49A or Wdr5S49E. n = 3. Error bars ± S.D. *,#p<0.05, Wdr5 S49E vs GFP, Wdr5WT or Wdr5S49A at Day 0 and Day 1 respectively. (F) Model depicting the role of Pask and Wdr5 phosphorylation in regulating MyoD recruitment to the Myog promoter during differentiation. See Discussion for detail.

DOI: http://dx.doi.org/10.7554/eLife.17985.023

Figure 7—source data 1. Numerical values from the ChIP analysis represented in Figure 7.
DOI: 10.7554/eLife.17985.024

Figure 7.

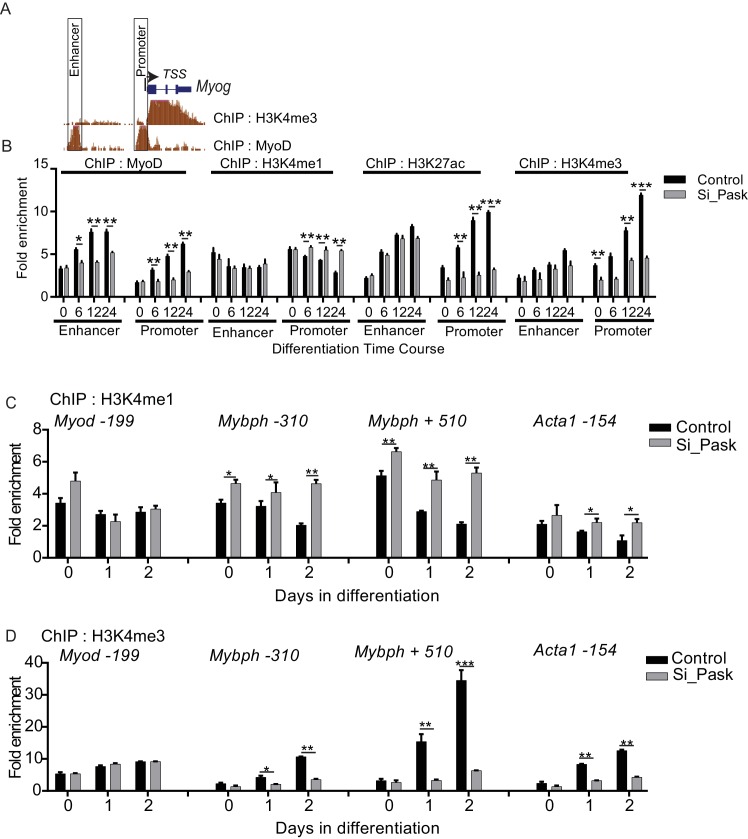
Figure 7—figure supplement 1. Pask and phosphomimetic Wdr5 promote H3K4me1 to H3K4me3 conversion and MyoD recruitment to the Myog promoter.

Figure 7—figure supplement 1.

(A) Depiction of the Myog locus showing abundance of position of enhancer and promoter region as well as H3K4me3 levels and MyoD occupancy 60 hr after initiation of differentiation from ENCODE datasets deposited by Barbara Wold lab. (B) ChIP-qPCR analyzing of differentiation time course of Control vs Pask silenced C2C12 cells using MyoD, H3K4me1, H3K27ac and H3K4me3 antibodies. Primers for enhancer and promoters are situated inside the boxed region depicted in figure supplement 6A. Actb negative region was used as normalizer. *p<0.05, **p<0.005, ***p<0.001 (C) H3K4me1 ChIP of control and Pask silenced C2C12 cells using primers spanning the indicated gene and position relative to the TSS. actb negative control region was used as the normalizer. *p<0.05, **p<0.005. (D) H3K4me3 ChIP of control and Pask silenced C2C12 cells using primers spanning the indicated gene and position relative to the TSS. actb negative control region was used as the normalizer. *p<0.05, **p<0.005, ***p<0.001.