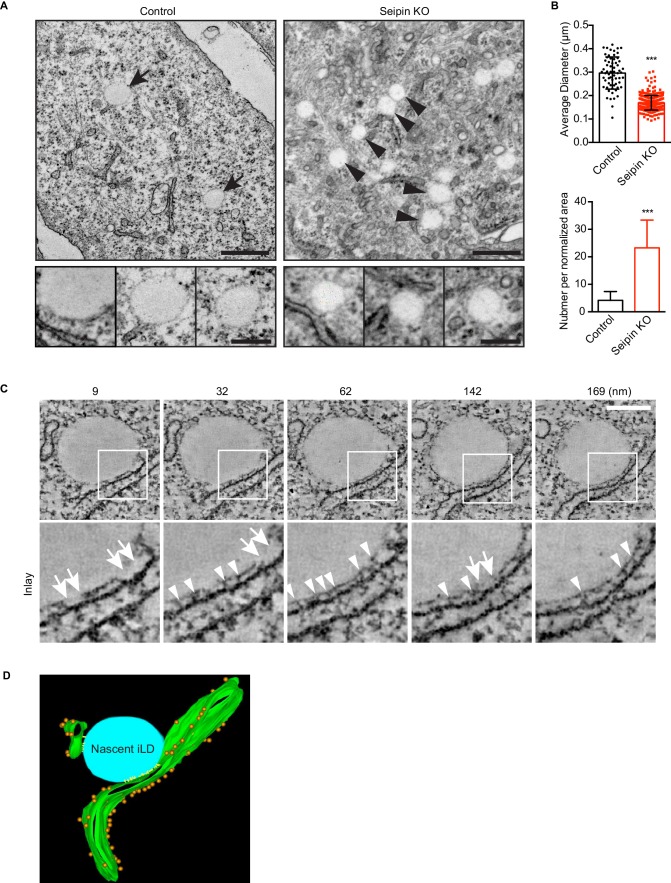
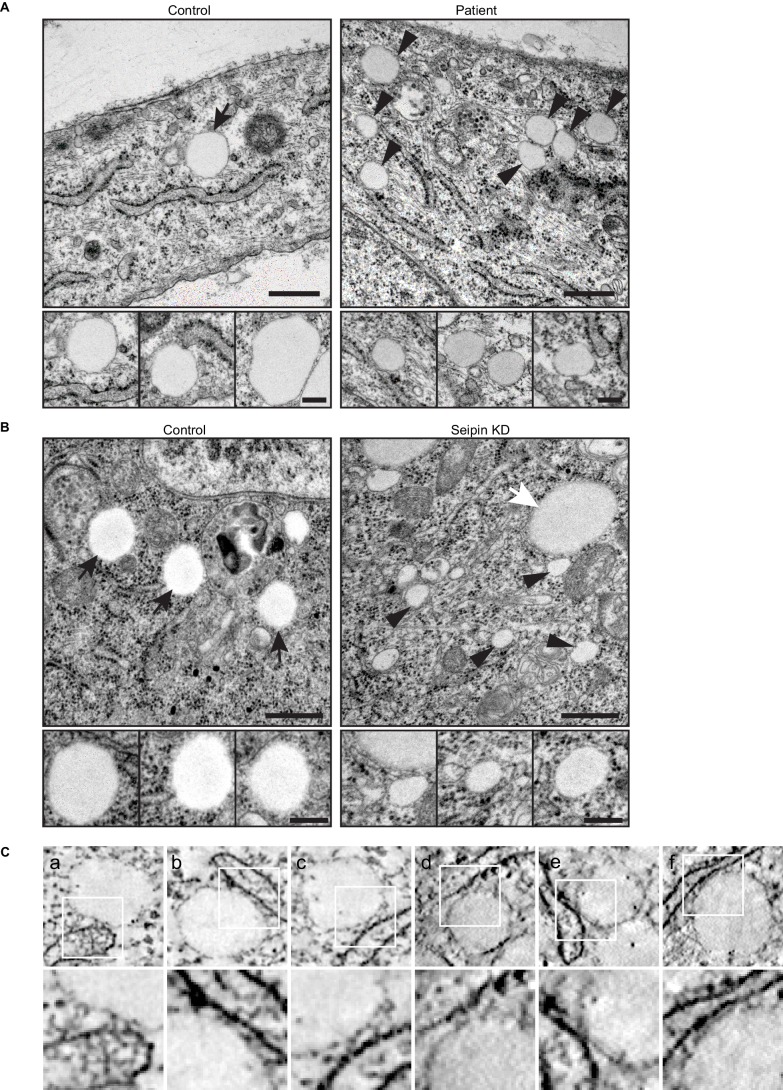
Figure 5. Seipin-deficient cells accumulate nascent LDs that are close to the ER.
(A) Control and seipin knockout SUM159 cells were fixed, embedded, and stained with uranyl acetate and lead citrate. Thin sections were imaged with transmission electron microscopy. Arrows, mature iLDs; arrowheads, nascent LDs. Close-up images (bottom row) are from different cell areas, representing different levels of proximity to the ER. Bars, 0.5 μm (top) and 0.2 μm (bottom). (B) Quantification of number and size of LDs in control and seipin-knockout SUM159 cells. Total of 15 areas from each phenotype were quantified. ***p<0.0001. (C) Electron tomography of a nascent LD in the seipin-knockout SUM159 cell. Thick sections of cells were imaged and reconstituted with IMOD. Serial sections from one example are shown. Numbers on top represent the relative position. Arrows, membrane contact zone; arrowheads, possible filamentous structures between nascent LDs and the ER. Bar, 0.2 μm. (D) Modeling of electron tomograms. Green, ER; blue, nascent LDs; orange, ribosomes; yellow, possible filamentous structure between nascent LDs and the ER. Rendering was performed with IMOD software. Movies of the tomograms are shown in Video 11.


