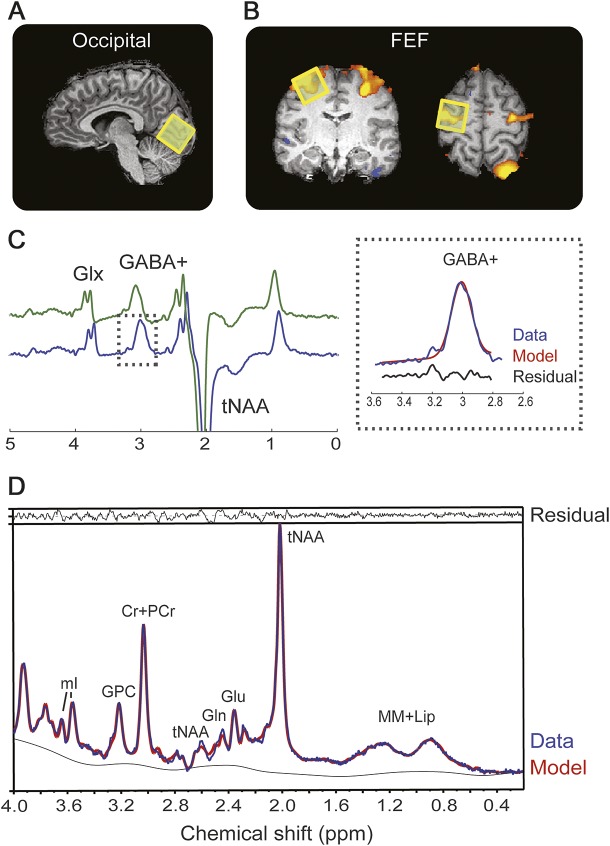
Figure 1. Magnetic resonance spectroscopy measurements.
Localization of the magnetic resonance spectroscopy voxel (yellow square) in the visual cortex (A) and FEF as localized with a functional localizer (B). (C) Edited magnetic resonance spectroscopy spectrum from a representative participant showing clearly resolved peaks for GABA+ and glutamine + glutamate (Glx). The inset on the right shows the fit output for the GABA+ signal. MEGA-PRESS spectra were processed using the Gannet 2.0 toolkit, the green line shows the raw GABA data, the blue line the postphase and frequency aligned GABA data, and the black line is the residual difference between the experimental data and the curve fit. (D) Single-voxel–localized PRESS spectrum (blue line) from a representative participant with spectral fits (red line) and the residual difference between the experimental data and the curve fit (black line) determined using LCModel. Cr = creatine; FEF = frontal eye field; GABA = γ-aminobutyric acid; Gln = glutamine; Glu = glutamate; GPC = glycerophosphocholine; mI = myo-inositol; PCr = phosphocreatine; tNAA = total N-acetylaspartate (NAA [N-acetylaspartate] + NAAG [N-acetylaspartylglutamine]).

