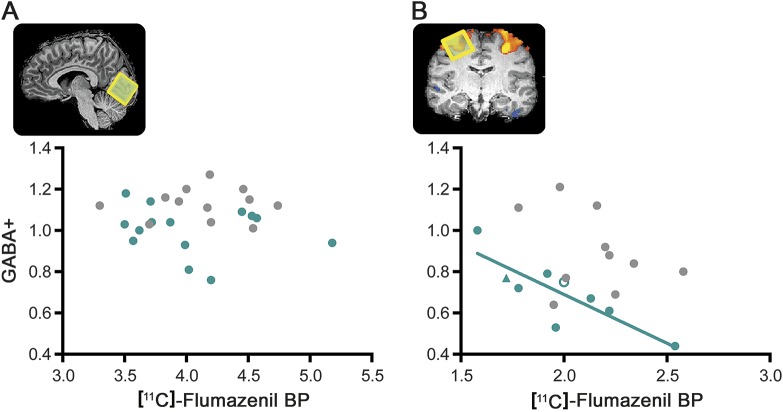
Figure 4. Cross-modality correlations between magnetic resonance spectroscopy and PET.
(A) Results for the occipital voxel and (B) for the FEF voxel, for patients with NF1 (green) and controls (gray). The triangle shape indicates a patient with NF1 in whom measurements were performed in the left hemisphere and the white-filled circle represents a patient in whom the FEF location was determined using anatomical landmarks. In patients with NF1, the concentration of GABA+ was negatively correlated with the density of GABA type A receptors in the FEF (r = −0.842, p = 0.004, n = 9, 95% confidence interval = −1.000 to −0.368 calculated from 10,000 bootstrap samples). BP = binding potential; FEF = frontal eye field; GABA = γ-aminobutyric acid; NF1 = neurofibromatosis type 1.

