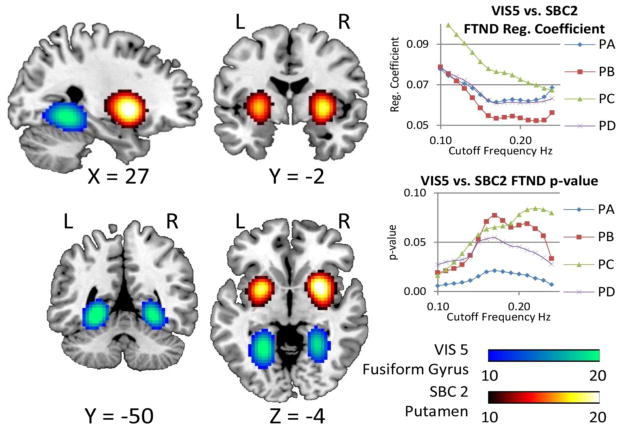
Figure 10.
RSN with significant group difference corrected using FDR. In addition, this RSN pair exhibit an increase in rsFNC correlated with FTND. The spatial content of these networks suggests a resting state interaction between reward and visuospatial brain networks. The two plots on the right show changes against bandwidth selection of FTND regression coefficients and corresponding p-values for each pipeline. Although PC exhibits the largest effect size, the significance of the regression coefficient is dependent on the bandwidth. PB has the lowest effect size and also shows high instability with respect to significance. The effect sizes of PA and PD are very similar. The p-values in PA are the lowest and always significant in showing the highest level of robustness against selected bandwidth.

