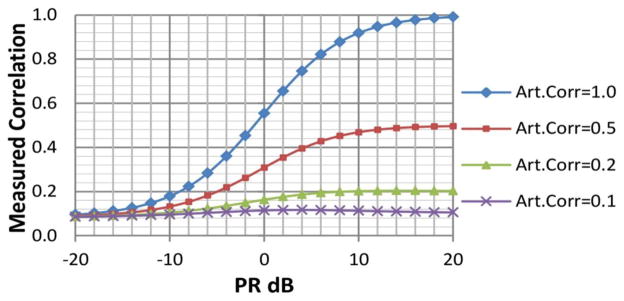
Figure 2.
Plot used to parameterize the simulation. This shows the relationship between final Measured Correlation, Power-Ratio (PR) and correlation between artificial signals. The plot uses two different time-courses: TC1 and TC2. These time-courses were extracted from fMRI data for two different RSNs using space-time-regression. The two time courses exhibit low correlation value. Two signals, S1 and S2, are algorithmically generated to have an artificial correlation Art.Corr[S1,S2] with different values 1.0, 0.5, 0.2 and 0.1. Signals and time courses are mixed and the measured correlation corr[TC1+S1, TC2+S2] is plotted for different, PR = (var[S]/var[TC]). After 0dB, Art.Corr dominates the measured correlation, but below −12dB its influence is minimal. The simulation was performed with PR = −9dB, aiming at minimizing changes in the characteristics of original time courses TC1 and TC2, but allowing a significant correlation level of 0.2. In our data, significant correlations (p<0.05) are those surpassing the threshold of 0.16.

