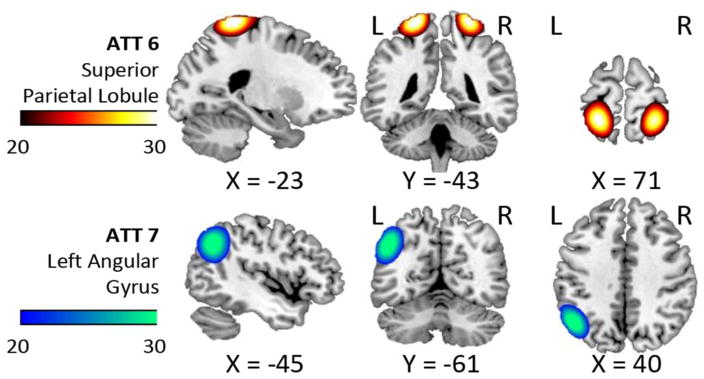
Figure 3.
Spatial content of the uncorrelated RSNs used in the simulation. The mean correlation between these two RSNs was low (ideally zero) in the HC samples. Simulated connectivity was achieved using these t-maps and space time regression to extract, modify and reintroduce artificial phase information. In this figure, images were cropped using t-value thresholds between 20 and 30 and the color bars indicate these levels.

