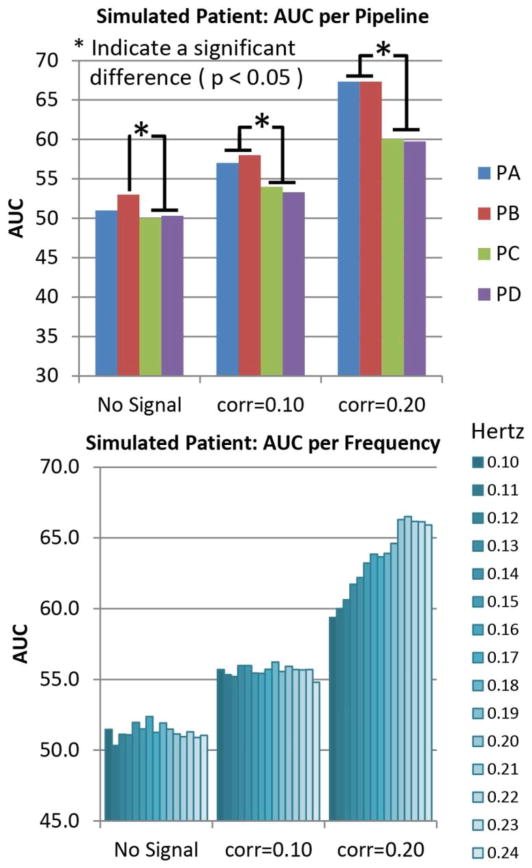
Figure 4.
Pipeline and Frequency performances for simulated data. Simulated increments of connectivity were achieved by artificially adding time coherent signals where the correlation significance threshold (p<0.05) is 0.16. The strongest connectivity case with correlation of 0.2 demonstrates the case of a significant correlation. The case with correlation of 0.1 is an artificially simulated no-significant correlation. The baseline case show results for the case where no signal was added. Results shown are averages of either pipeline or frequency dimensions. Pipelines PA and PB exhibit better performance than PC and PD for cases where signals were introduced. Frequency results are different from chance only for the largest simulated connectivity of 0.2. The best frequency bandwidth in the 0.20 case was the range [0.01 0.22] Hz. There were no significant differences among bandwidths with high cut-off 0.20, 0.21, 0.22,0.23 and 0.24 Hz on all three bar plots. Otherwise, most of the AUC differences were significant in the frequency dimension. The number of significant differences was too high to fit in the figure.

