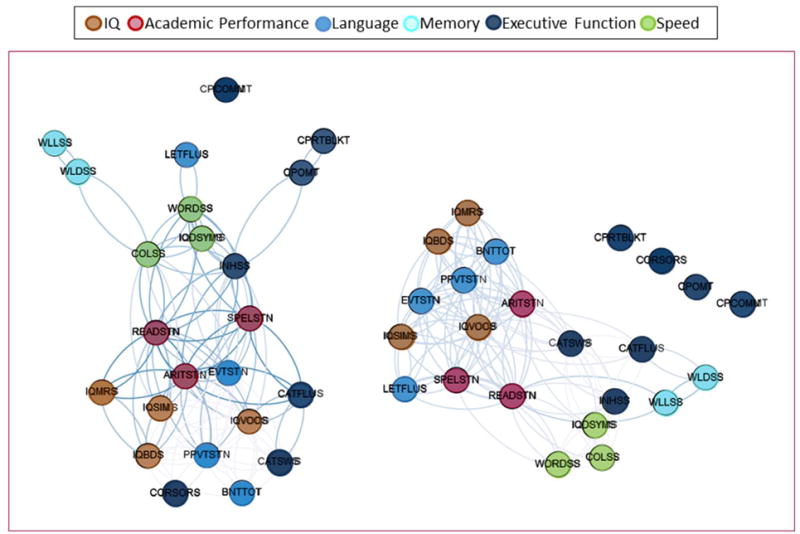
Figure 2. Community structure of cognitive landmarks.

Two-dimensional graph representation illustrating the spatial relationship between cognitive tests in controls (left) and children with epilepsy (right). The spatial distribution of nodes was calculated using the force-atlas graph algorithm, where nodes that demonstrated stronger connections are located closer in space, whilst nodes with fewer connections tend to drift away. Nodes with a similar color belong to the same domain. Reproduced with permission.
