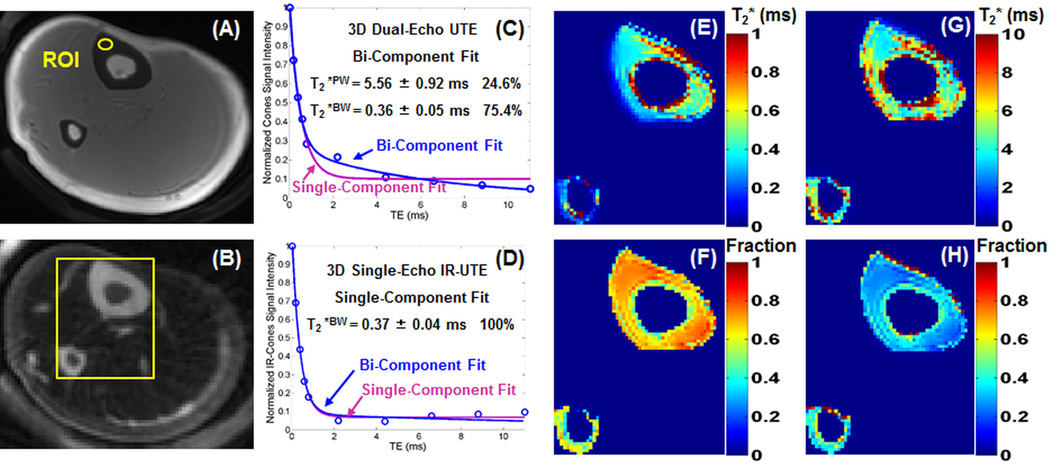
Figure 5.
Representative 3D–UTE-Cones (A) and 3D-UTE-IR-Cones (B) images of the tibial midshaft of a 28-year-old healthy volunteer, bi-component and single-component fitting of 3D-UTE-Cones images with a TE of 32 µs (C) and 3D-UTE-IR-Cones images with a TE of 32 µs (D), as well as maps of bound water T2* (E), bound water fraction (F), pore water T2* (G) and pore water fraction (H) derived from five sets of dual-echo bi-component fitting of 3D-UTE-Cones images in a total scan time of 9 min. The 3D-UTE-Cones images show a bi-component T2* decay with a short T2*BW of 0.36 ± 0.05 ms and a longer T2*PW of 5.56 ± 0.92 ms, accounting for 75.4% and 24.6%, respectively. A single component was observed in the 3D-IR-UTE-Cones images with a short T2*BW of 0.37 ± 0.04 ms.

