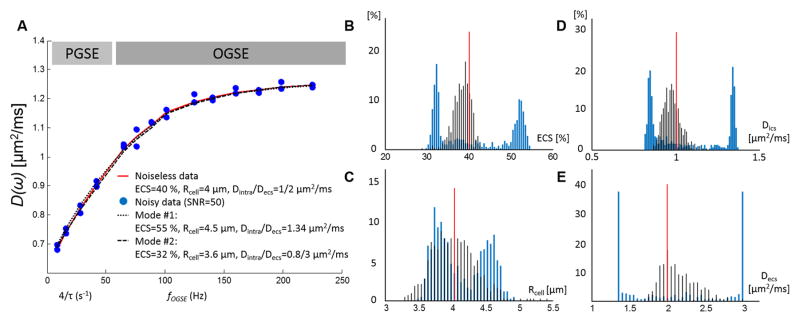
Figure 2.
Time-dependent diffusion over-fitting with four independent variables. A. Combination of PGSE and OGSE data (light and dark gray) in the range [31 ms ; 225 Hz] based on Eq. [3–6] and realistic estimates (ECS = 40%, Rcell = 4 μm, Dics/Decs=1/2 μm2/ms, D0,ecs = 2.7 μm2/ms). When fitting four independent variables, small variations due to noise (blue circles, SNR=50, 2 time-points per time / frequency) lead to bimodal distributions (blue lines) of the estimated ECS fraction (B), cell radius (C), intra-(D) and extracellular diffusivities (E). The red lines correspond to the parameter nominal values. Alternatively, when Dics is fully constrained based on Eq. [8a] and OGSE data in the short time regime (fOGSE > 88 Hz), the distributions of the parameter estimates (black lines) are centered around the nominal values.

