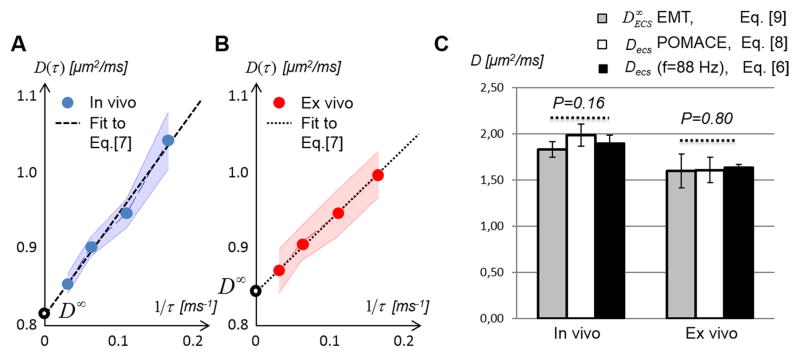
Figure 4. Long time-dependence of the diffusion coefficient in the tumor.
Both A. in vivo and B. ex vivo PGSE-based D(τ) decrease linearly with 1/τ. Standard deviations within the tumor ROI are represented by the blue / red areas. C. Comparison of the ECS diffusivities derived from the POMACE model (Decs, white) with values extrapolated from the PGSE data in the long time regime ( , grey), and from the short-time regime at fOGSE = 88 Hz (black) for in vivo (left column) and ex vivo (right column) PGSE measurements.

