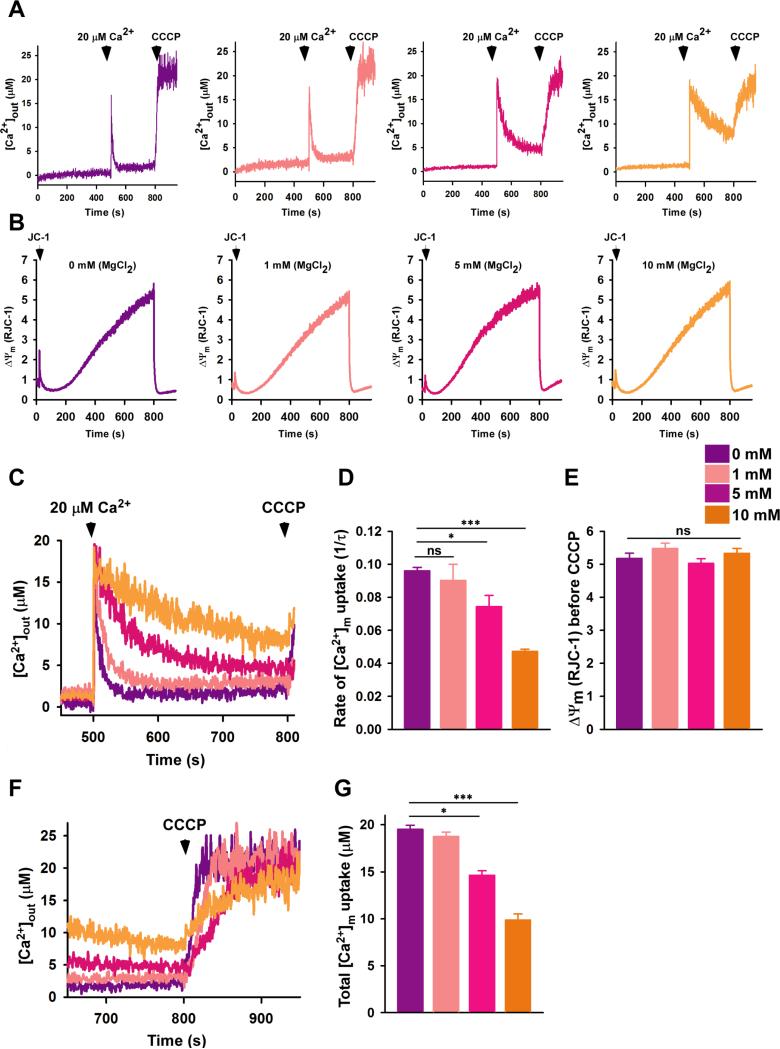
Fig. 5. Mg2+-dependent MCU inactivation in live cells.
(See also Fig. S6).
(A) Permeabilized HEK293T cells were pulsed with 20 μM Ca2+ in the presence of MgCl2 as indicated. Representative traces show changes in extramitochondrial Ca2+ concentrations ([Ca2+]out); (n=3 independent experiments).
(B) Representative traces show ΔΨm (i.e. JC-1 ratio) in permeabilized HEK293T cells in response to Ca2+ and CCCP. The [Ca2+]out and ΔΨm traces were acquired simultaneously; (n=3 independent experiments).
(C) Overlay of kinetic changes in [Ca2+]out during 300 s in the presence of different MgCl2 concentrations.
(D) The rate of mitochondrial Ca2+ uptake was calculated as 1/τ. Mean ± SE. *P < 0.05, ***P < 0.001; (n=3 independent experiments).
(E) Quantification of ΔΨm before the addition of CCCP. Mean ± SE. n.s., not significant; (n=3 independent experiments).
(F) and (G) Quantification of [Ca2+]m after CCCP addition. Mean ± SE. *P < 0.05, ***P < 0.001; (n=3 independent experiments).

