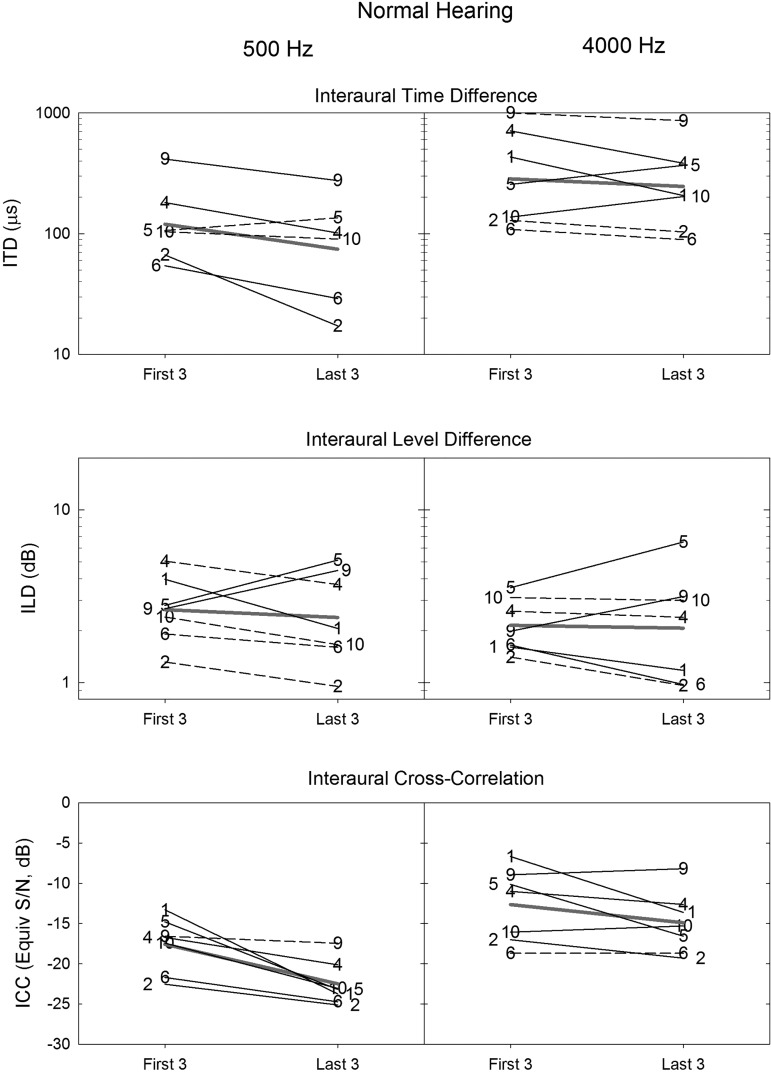
FIG. 2.
(Color online) Performance-change data for the NH listeners. First-three and last-three performance thresholds are shown for individual NH listeners using thin lines, with each labeled by subject number. Mean first-three and last-three performance thresholds are shown by thick lines (red if shown in color). Individual and mean performance thresholds are described for interaural time difference sensitivity tasks in the top row, interaural level difference sensitivity tasks in the middle row, and interaural correlation coefficient tasks in the bottom row. Lines for changes exceeding the one-level threshold are solid, those for smaller changes are dashed.

