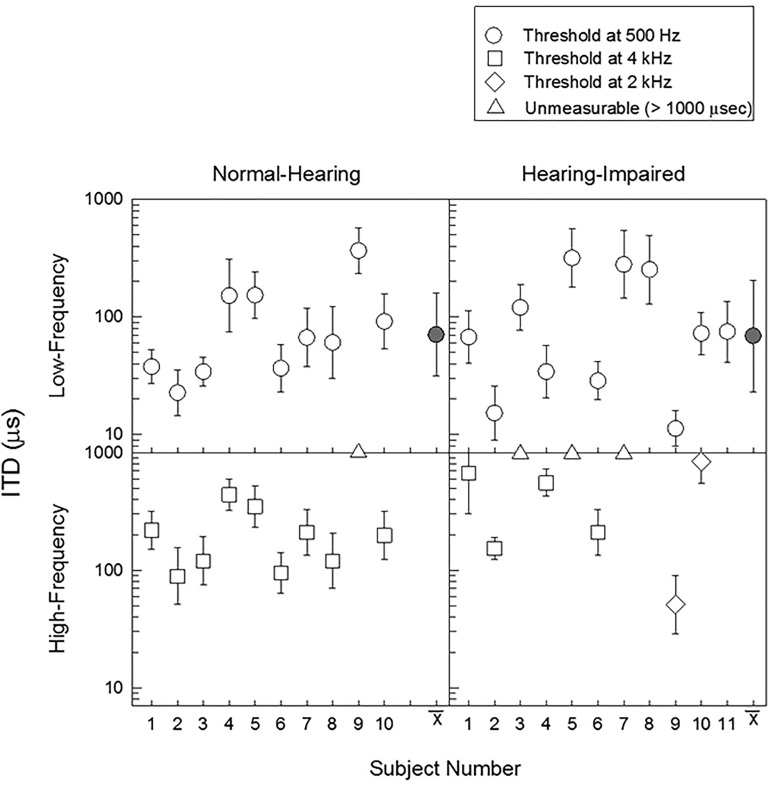
FIG. 4.
Interaural time difference sensitivity thresholds for normal-hearing (left panels) and hearing-impaired (right panels) listeners. Within each listener group, mean with standard deviation are shown for individual subjects (open symbols) and averaged across subjects (filled symbol). Low frequency data (500 Hz, ○) are plotted on the top row, and high frequency data (4 kHz, ◻; 2 kHz, ⋄, see text for explanation) are plotted on the bottom row. Unmeasurable thresholds (i.e., thresholds greater than 1000 μs) are plotted as triangles at 1000 μs. The mean 500-Hz ITD threshold for the NH listeners was 58 μs, compared with 68 μs for the HI listeners.

