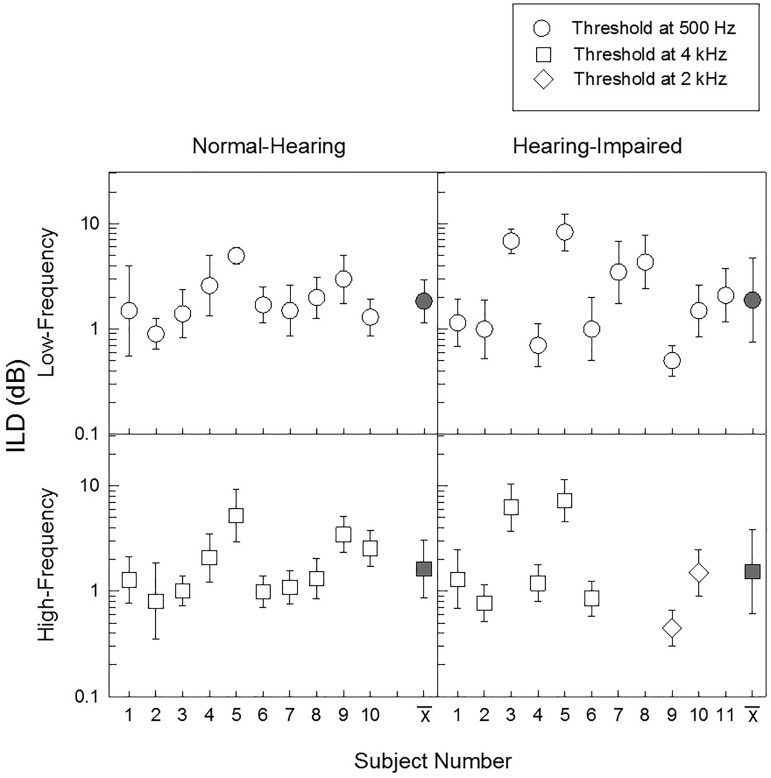
FIG. 5.
Interaural level difference sensitivity thresholds for normal-hearing (left panels) and hearing-impaired (right panels) listeners. Within each listener group, mean with standard deviation are shown for individual subjects (open symbols) and for averages across subjects (filled symbols). These mean values include individual values for which thresholds were beyond the roving level limit. Low frequency data (500 Hz, ○) are plotted on the top row, and high frequency data (4 kHz, ◻; 2 kHz, ⋄, see text for explanation) are plotted on the bottom row. The 500-Hz and 4-kHz mean ILD JNDs for the NH group were 1.9 and 1.9 dB, compared with 1.7 and 1.6 dB for the 500-Hz and high-frequency mean ILD JNDs for the HI group.

