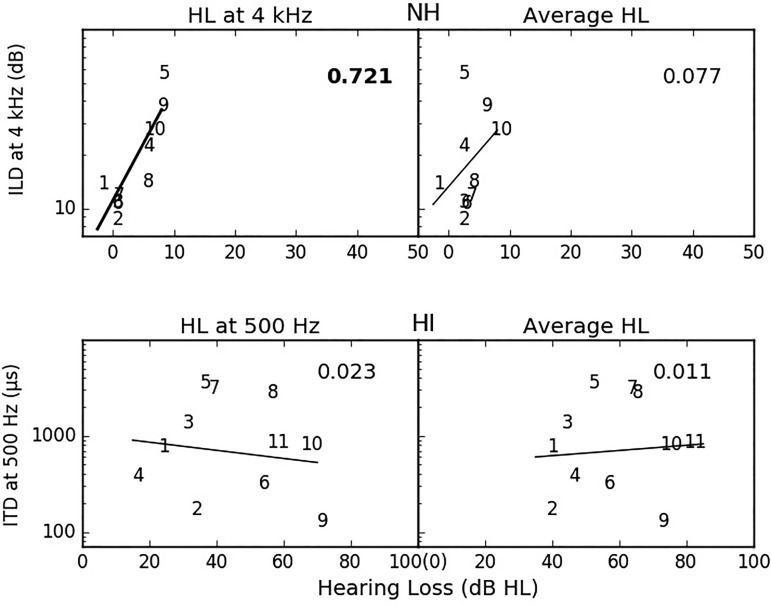
FIG. 8.
Scatter plots of selected interaural difference thresholds as a function of hearing loss (hearing level in dB) at the task frequency in the left panels and as a function of average hearing loss in the right panels. (Average hearing loss was calculated using frequencies at octave intervals from 250 Hz to 4 kHz.) Upper panels show 4-kHz ILDs for normal-hearing listeners and the lower panels show 500-Hz ITD JNDs for the HI listeners. R-squared values are plotted in the upper-right corner of each panel. R-squared values are in bold and fit lines are thick when correlations are statistically significant (p < 0.05).

