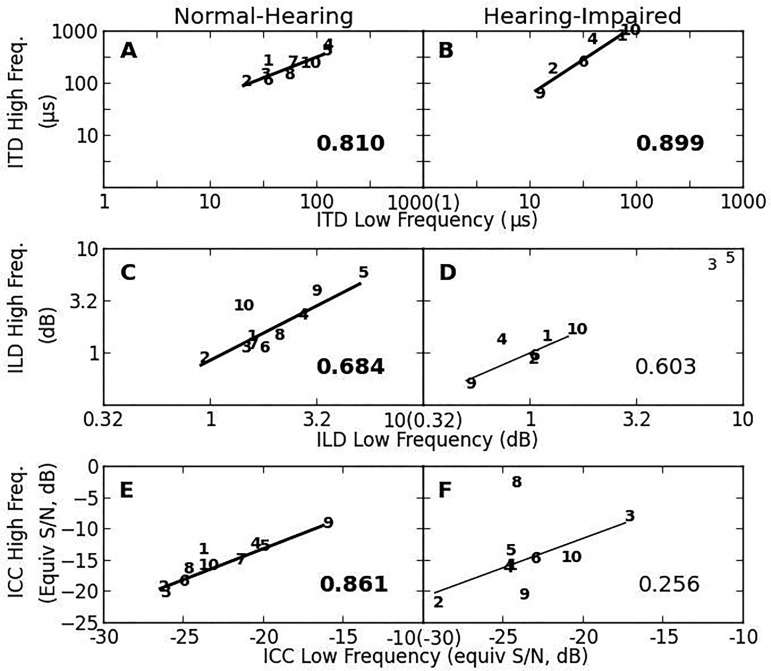
FIG. 9.
Within-task frequency dependence of JNDs for ITD (top), ILD (middle), and ICC (bottom) for NH listeners (left panels) and HI listeners (right panels). For each task, performance for high frequency stimuli is plotted against performance for low frequency stimuli. R-squared values are plotted in the lower-right corner of each panel. R-squared values are bold and fit lines are thick when correlations are statistically significant (p < 0.05). For ITD JNDs for both groups, correlations were statistically significant (p < 0.05). For ICC and ILD JNDs, thresholds significantly correlated across frequency for the NH group (p < 0.05) but not for the HI group (p > 0.05). Subject numbers for listeners included in the correlation are in bold. Those for listeners excluded in the correlation are not in bold.

