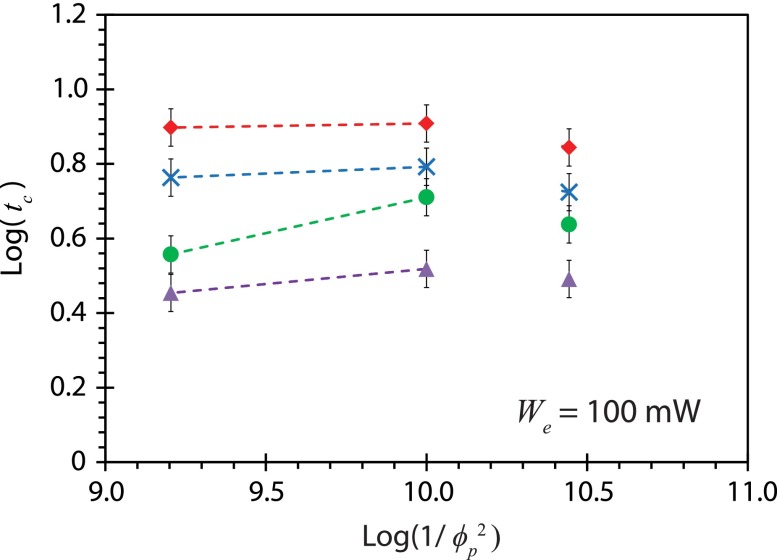
FIG. 9.
Relationship between the concentration time tc interpolated from the data in Fig. 8 as a function of the particle dimension scaling for a fixed input power (100 mW), under different amplitude modulations condition: fm = 0 (without modulation) (◇), fm = 1 kHz (×), fm = 5 kHz (●), and fm = 15 kHz (△). Error bars indicate a ±2 standard deviation (95% confidence level) from the mean.

