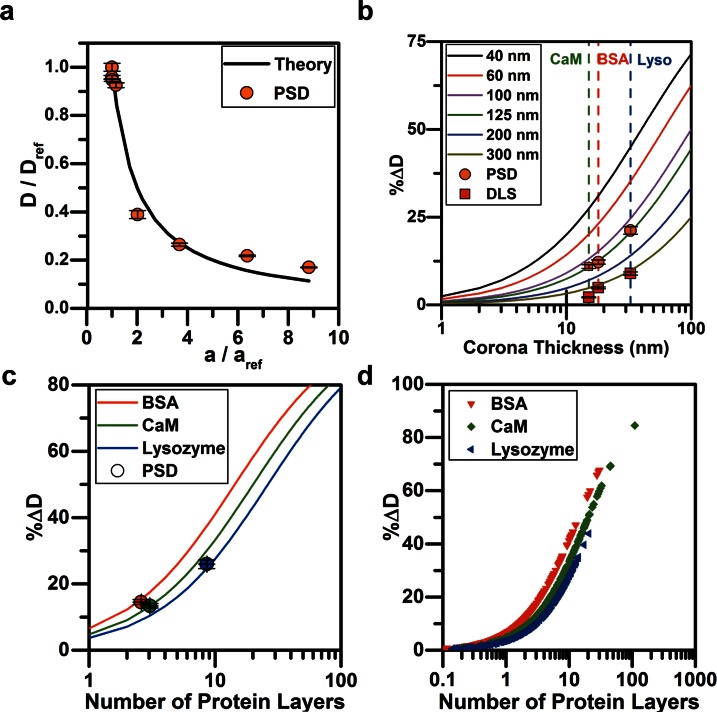
FIG. 5.
Theory vs. experiments. (a) The ratiometric diffusion coefficients for particles of 100 nm, 300 nm, 520 nm, 1 μm, and 2 μm in diameter, and 100 nm biomolecule conjugated particles were measured by PSD and compared with the diffusion coefficient of the 100 nm bare gold nanoparticles (Eq. (2)). The RMSE between theory and experiments was 6.04%. In (b)–(d), the %ΔD indicates the percent change in the diffusion coefficient. (b) The %ΔD was theoretically determined for particles ranging from 40 nm to 300 nm in diameter as a function of the biomolecule size conjugated to the AuNP. The experimental data points (for the BSA (red), CaM (green), and lysozyme (blue) conjugated AuNPs) were calculated from PSD and DLS results and compared with theory. The dotted lines correspond to the thickness of the layer of each biomolecule as measured by TEM. (c) The percent change in diffusion coefficient as a function of the number of protein layers added to the 100 nm AuNP. Each protein's Stokes radius changes the diffusion coefficient of the particle. Measurement of the %ΔD and knowledge of the protein stokes radius facilitates prediction of the average number of layers of protein present on the particle using PSD. (d) The number of predicted protein layers on BSA, CaM, and lysozyme conjugated nanoparticles is calculated from separate interrogation areas and each point is plotted to visualize the distribution within each treatment.

