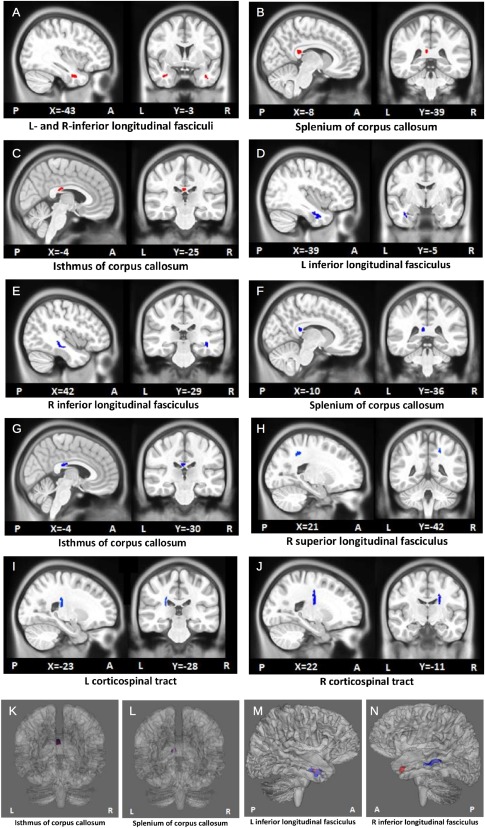
Figure 1.

Clusters in which the mean FA is lower (red; A–C) or the mean MD is higher (blue; D–J) in children with FAS/PFAS compared to controls. Volumes are shown in MNI pediatric standard space. See Table 2 for associated cluster information. The locations of the FA‐ and MD‐derived clusters which directly overlapped are also highlighted (K,L), as well as one set which was found within the same WM structure (M). [Color figure can be viewed in the online issue, which is available at http://wileyonlinelibrary.com.]
