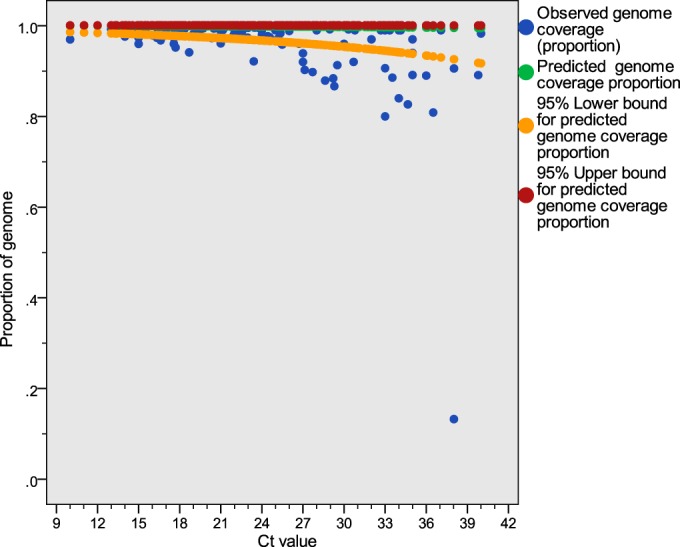
FIG 5.

Observed and predicted genome coverage values with 95% prediction intervals, excluding outliers identified in Fig. SA3 in the supplemental material. The fitted linear regression model is y = 7.432 − 0.059x, where the dependent variable y is the logit-transformed genome coverage proportion and the independent variable x is the PCR CT value (n = 477).
