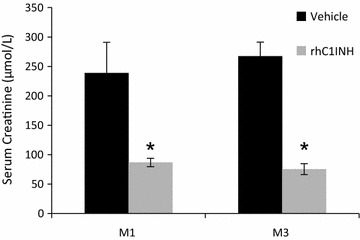
Fig. 2.

Chronic function. Evolution of serum creatinine at months 1 and 3 of post-transplant follow up. Shown are mean ± SEM, n = 7. Statistics: *p < 0.05. Serum creatinine values at M1 and M3 were normally distributed but did not show equality of variance on the Modified-Levene Equal-Variance Test, hence non parametric analysis was performed
