Fig. 3.

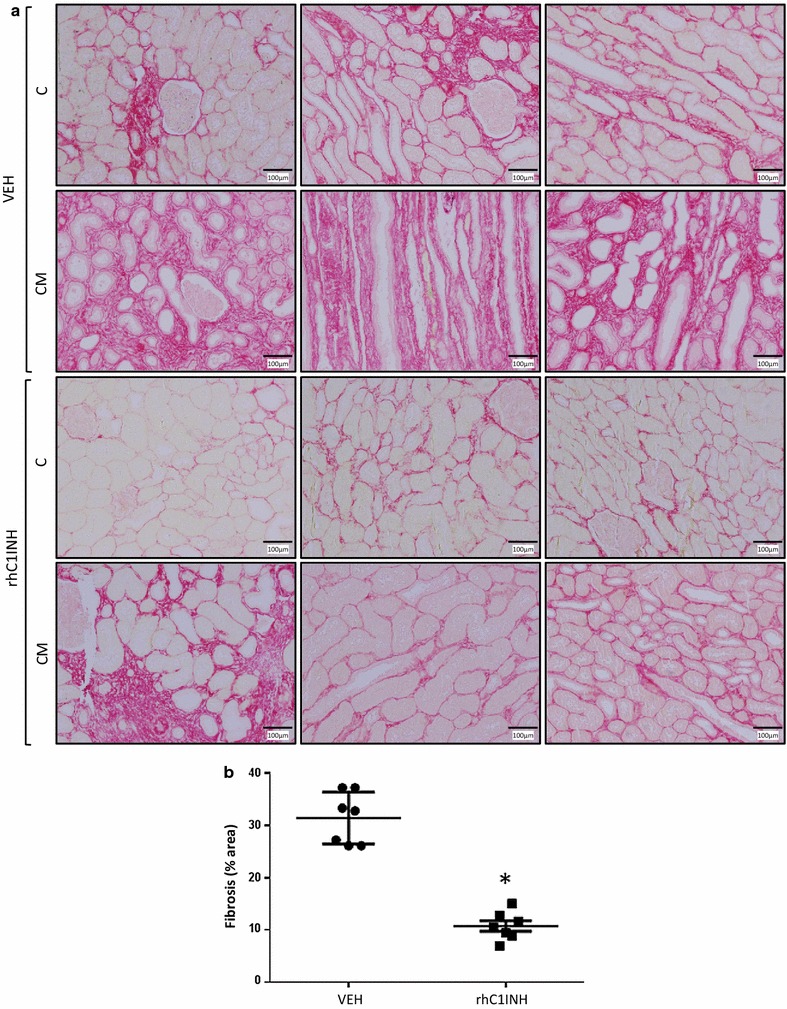
Chronic fibrosis development at 3 months follow up. Pigs were euthanized after 3 months follow up and kidney biopsies were collected and processed for immunohistochemical analysis. Sirius Red labelling and quantification was performed. a Representative staining for each group in the cortex (C) and corticomedullar (CM) areas. b quantification of the area covered by the staining per high powered field (×100). Shown are mean ± SD, n = 7. Statistics: *p < 0.05. Fibrosis data were normally distributed and had equal variance, hence parametric analysis was performed
