
Fig. 1.
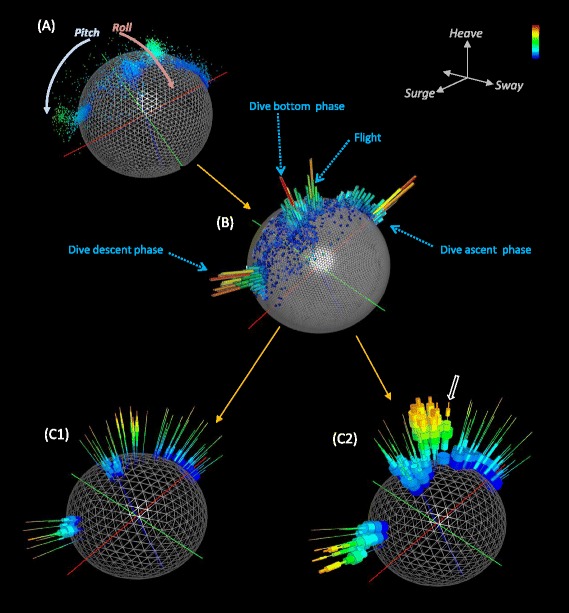
Example behavioural data from a cormorant. Six dives and a short period of flight are visualised by (a) a point- based g-sphere [with point colour equating with DBA]. b shows the same data as (a) but as a Dubai plot. Both (c) images depict urchin plots of (b); C1 shows percentages of DBA allocation taken across the whole g-sphere while C2 shows percentages amounting to 100 % per facet. Note the higher values of DBA attributed to flight and descent of the water column, particularly emphasized by the 100 % facet percentage. Note also how certain spines show multi-modes (e.g. white arrow) which can be indicative of different behaviours at one body attitude