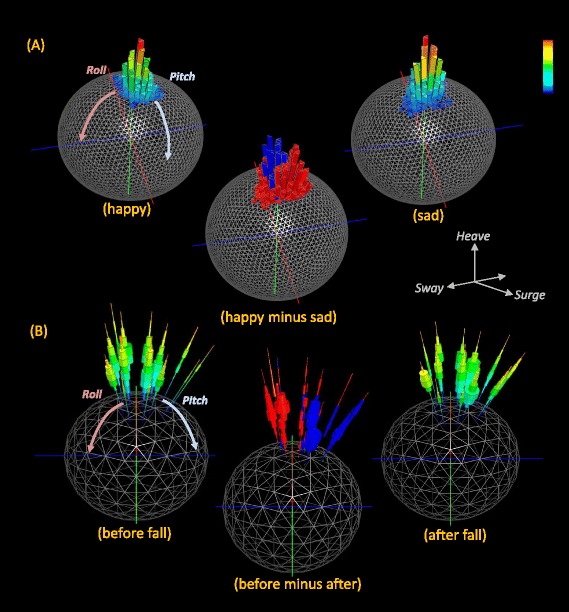
Fig. 4.

Example posture and DBA values associated with ‘state’ in humans. a shows two Dubai plots for a person walking after seeing ‘happy’ and ‘sad’ film clips (higher frequencies are coded by warmer colours). A third differential Dubai plot highlights the difference between the two situations (blue = a higher relative frequency of ‘happy’ points per facet while red = a higher relative frequency of ‘sad’ points per facet). Note how the two conditions are reflected in the postural changes (b) shows urchin plots for someone trekking across snow pulling a sledge one minute before a fall and one minute after recovering from the fall. The differential urchin shows both differences in postures adopted between the two situations as well as the dynamism of the walking (red shows a higher relative DBA frequency ‘before the fall’ while blue shows the reverse)
