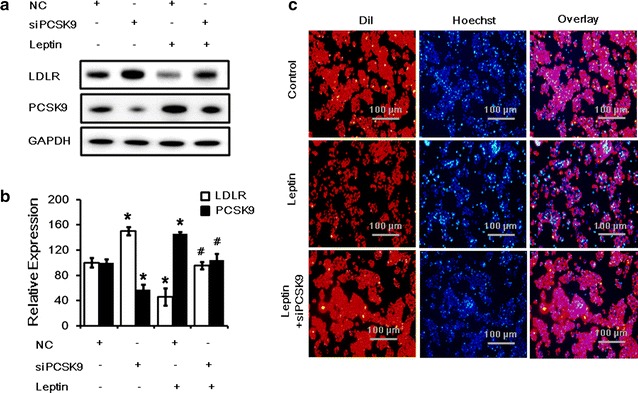
Fig. 2.

Inhibition of PCSK9 expression returned LDLR expression and LDL uptake during leptin treatment in HepG2 cells. a Western blot analysis of LDLR and PCSK9 protein levels in HepG2 cells transfected with siPCSK9 (40 nM) and then treated with leptin (50 ng/mL) for 24 h. bThe normalized intensities of LDLR and PCSK9 versus GAPDH are presented as the mean ± SD of three independent experiments. c Representative fluorescence microscopy images of cell-associated Dil-LDL (red), Hoechst-stained nuclei (blue), and the overlay. *p < 0.05 represent significant differences compared to the vehicle-treated cells. # p < 0.05 represent significant differences compared to the leptin-treated cells
