
Fig. 3.
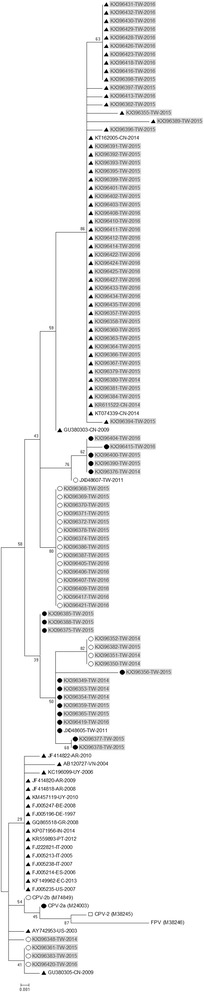
Phylogenetic analysis of nucleotide sequences of the partial VP2 genes of CPV-2 strains (522 bp). The phylogenetic tree was constructed using the maximum likelihood method with bootstrap analysis (n = 1,000) to determine the best fitting tree. CPV variants are indicated by □, ●, ○, and ▲ for CPV-2, 2a, 2b, and 2c, respectively. The gray diagram represents the Taiwanese CPV-2 variants in this study