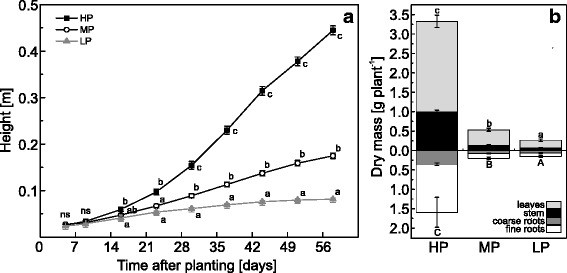
Fig. 1.

Growth characteristics of P deficient poplar. a Height of poplar plants grown with high (HP: 641 μM), medium (MP: 6.4 μM) or low (LP: 0.064 μM) phosphate concentrations in the nutrient solution. Different letters indicate significant differences between treatments at each measuring day (p ≤ 0.05, 2-Way-repeated measurement-ANOVA and Tukey’s honest significance test, n = 11-12, mean ± SE, ns: not significant). b Dry mass of poplar tissues after 60 days of growth with HP, MP or LP phosphate in the nutrient solution. Different letters indicate significant differences between treatments in above- and belowground tissues (p ≤ 0.05, ANOVA and Tukey’s honest significance test, n = 5, mean ± SE)
