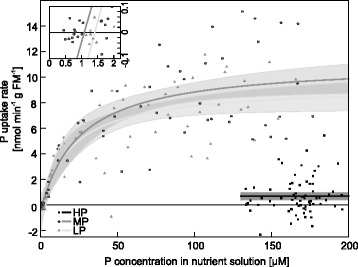
Fig. 4.

Model of kinetic parameters for P uptake of P deficient poplars at different P concentrations. P uptake rate per gram of fine root mass of plants grown with different P concentrations in the nutrient solution (black squares: HP, 641 μM; open circles: MP, 6.4 μM; grey triangles: LP, 0.064 μM) during exposure to different P concentrations. Data points from six different plants per treatment. Modeled curves (HP: black, MP: dark grey, LP: light grey) with parameters from Table 2 and 95 %-prediction interval in grey. The insert shows an enlargement of the curves at intermediate and low P concentrations around the concentration of Cmin
