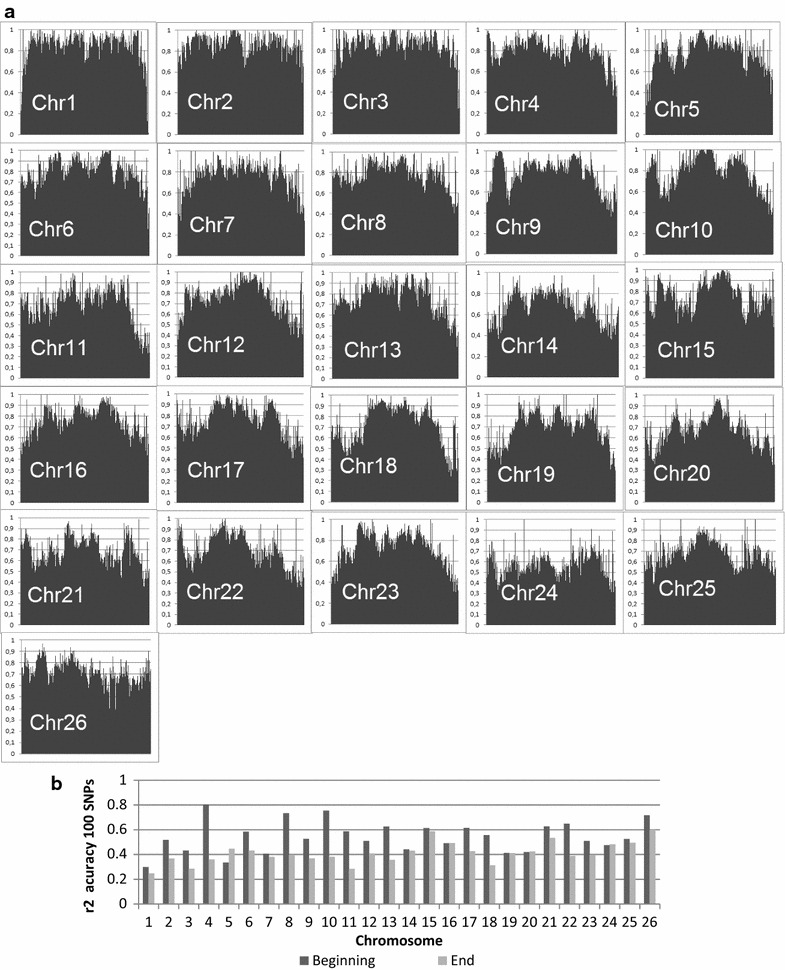
Fig. 7.

Imputation accuracy per chromosome and at both chromosome ends. a Squared Pearson correlation measure of imputation accuracy (r2) across different chromosomes after imputation from 5K to 50K for Romney sheep using the FIMPUTE software (Scenario 27_5K50K). b Squared Pearson correlation measure of imputation accuracy (r2) for both ends of each chromosome (each chromosome end is covered by 100 markers); imputation accuracy defined as the average r2 value for the 100 markers
