
Fig. 4.
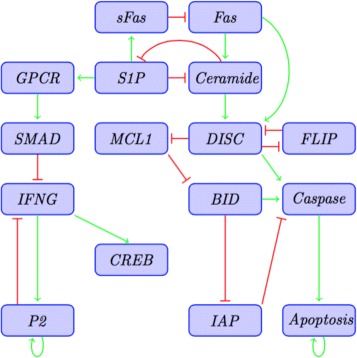
Reduced T-LGL network adapted from [10]. Arrows in green represent activation while hammerhead arrows (in red) represent inhibition. All the negative edges from Apoptosis were omitted for simplicity
Official websites use .gov
A
.gov website belongs to an official
government organization in the United States.
Secure .gov websites use HTTPS
A lock (
) or https:// means you've safely
connected to the .gov website. Share sensitive
information only on official, secure websites.
Reduced T-LGL network adapted from [10]. Arrows in green represent activation while hammerhead arrows (in red) represent inhibition. All the negative edges from Apoptosis were omitted for simplicity