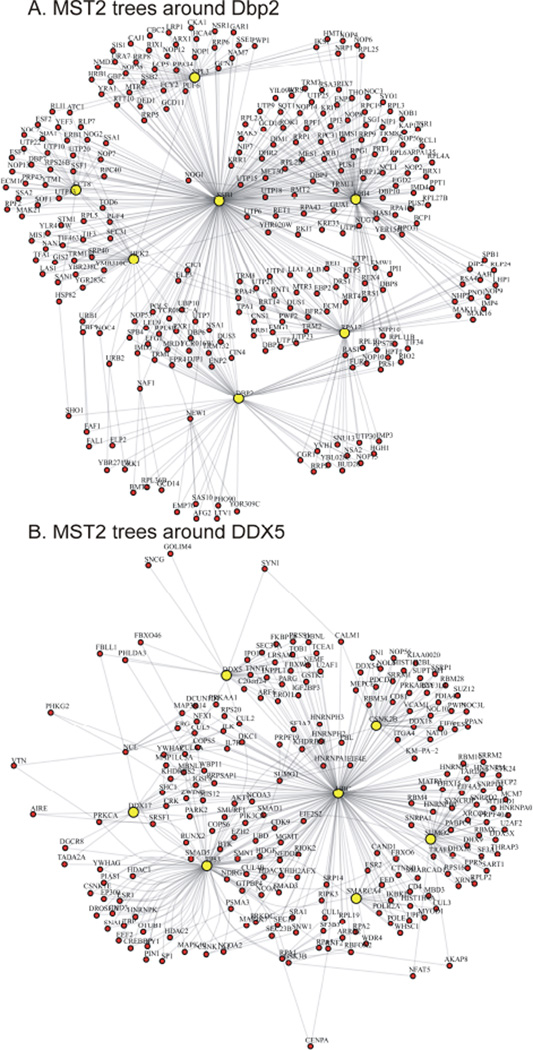
Figure 2.
MST2 trees around PPIs of Dbp2 yeast helicase (A) and its human homolog DDX5 (B), derived from the respective networks shown in Fig. 1 (using R with iGraph package). Fine network structure becomes visible, with highly connected molecular chaperons, protein modifiers and regulators occupying central positions (UBI4, SSB1 in yeast, and Ubiquitin and p53 in human). Figure 4

