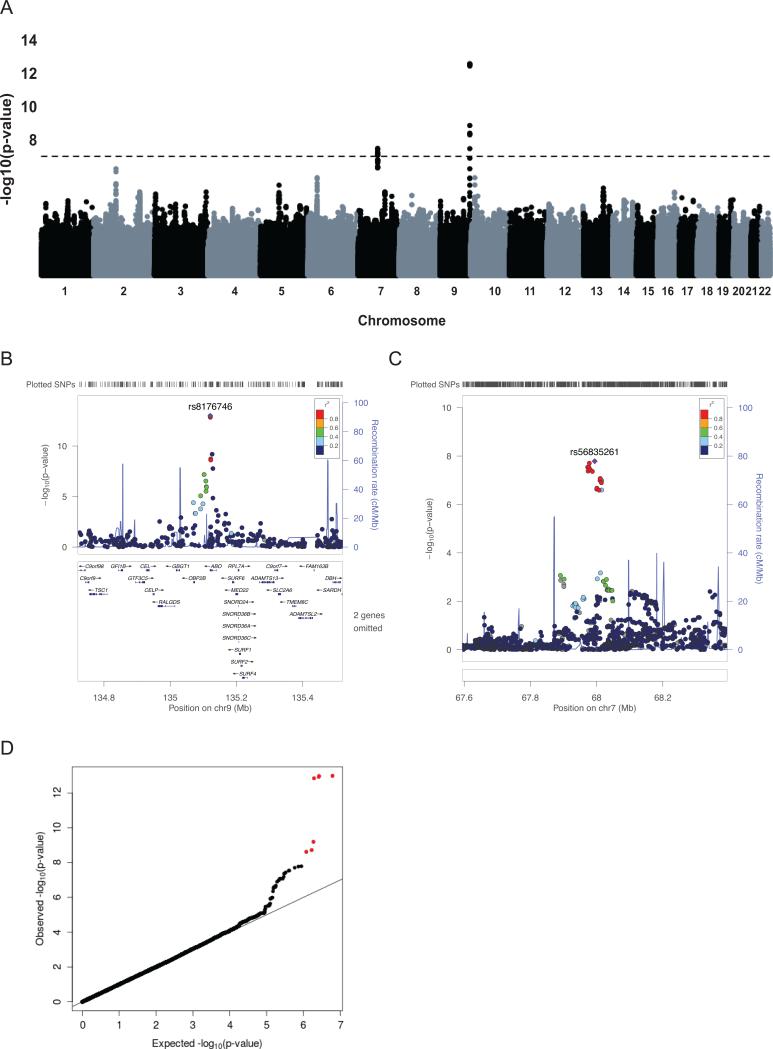
Figure 1. VWFpp Meta-analysis results.
(A) Genome-wide plot of −log10(P) for ~4.51 million SNPs. The dotted line marks the 1.10 × 10⁻⁸ threshold of genome-wide significance. (B) Regional plot for the associated region on Chr 9q34. (C) Regional plot for the associated region on Chr 7q11.22. (D) Quantile-quantile plot of observed vs. expected −log10(P) for VWF meta-analysis. The observed −log10(P) > 7.96 are shown in red.

