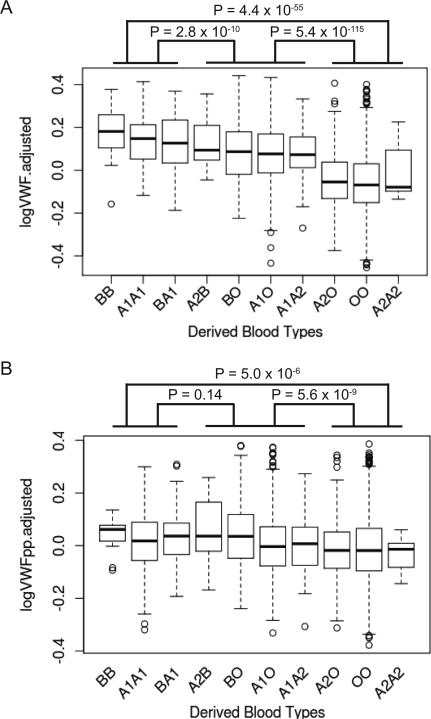
Figure 2. Distributions of log transformed and covariate adjusted VWF and VWFpp levels in the combined GABC and TSS cohorts (N=3,238) grouped by SNP derived ABO haplotype groups.
P-values show the comparisons between the homozygous high (BB, A1A1, BA1), heterozygous high/low (A2B, BO, A1O, A1A2) and homozygous low groups (A2O, OO, A2A2) (with “high” and “low” defined by their adjusted VWF levels).

