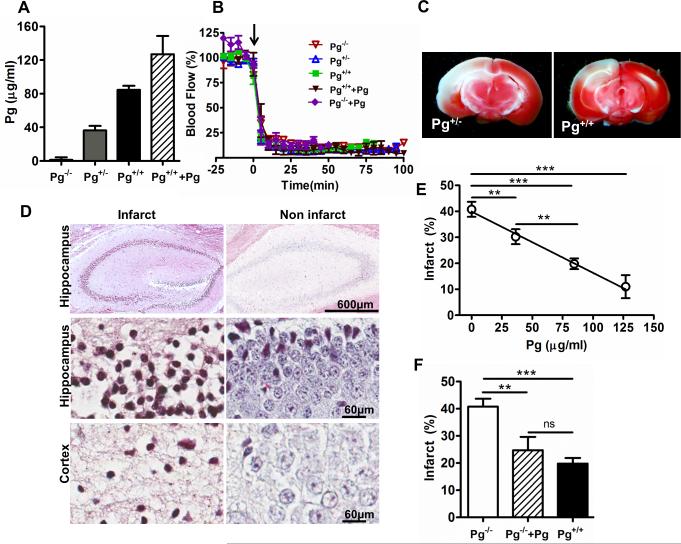
Figure 1. Pg levels show an inverse dose-response relationship with the extent of brain infarction after MCA thromboembolism.
(A) Plasma Pg levels in mice with different Pg genotypes (Pg−/−, Pg+/−, Pg+/+ and Pg+/+ mice with increased Pg levels) as measured by Pg activation assay. (B) Representative tracings of laser Doppler blood flow in the ischemic hemispheric in mice after thromboembolism. Arrow indicates the time when clot was injected (C) Representative TTC-stained brain sections from Pg+/− and Pg+/+ mice after stroke as labeled. (D) Representative MSB stained images of hippocampus (4x and 40x) and cortex (40x) regions of infarct and non-infarct brain hemispheres after 6 h ischemic stroke showing cell death. (E) Regression analysis (line graph) shows a significant inverse dose-relationship between Pg levels and the extent of brain infarction in Pg−/−, Pg+/− and Pg+/+ mice (n=43 mice, 10-14 per group) and Pg+/++Pg mice (Pg+/+ mice with increased Pg level) n=6.**p<0.01, ***p<0.001 (F) Intravascular Pg (10 mg/Kg) supplementation to Pg−/− mice (n=5) reduced the cerebral infarct size to levels comparable to Pg+/+ mice (bar graph) as measured through TTC staining after 6 h stroke. **p<0.01, ***p<0.001, ns (non- significant).

