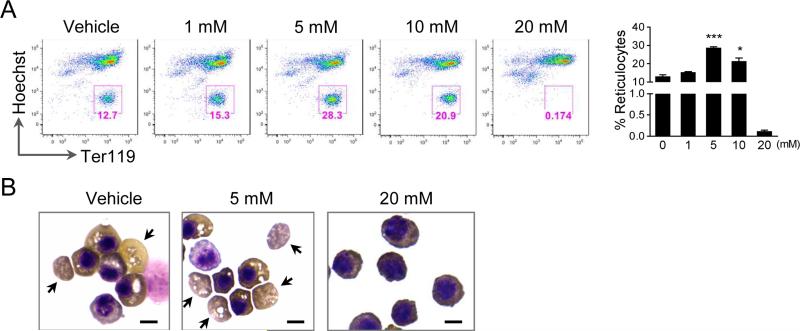
Fig. 4.
Inhibition of ROS promotes enucleation. (A) Flow cytometric analysis of enucleation of Ter119 negative mouse fetal liver erythroblasts cultured in Epo (2 units/ml) containing medium in the presence of different concentration of NAC for 48 h. Hoechst was used for the DNA staining. Statistical analysis with student's t-test is on the right. Data were obtained from three independent experiments and presented as mean ± SD. * p <0.05; *** p <0.001. (B) Benzidine–Giemsa staining demonstrating cell morphology of the in vitro cultured erythroblasts in the present of NAC for 48 h. Arrows indicate incipient reticulocytes. Scale bar: 5 μm.

