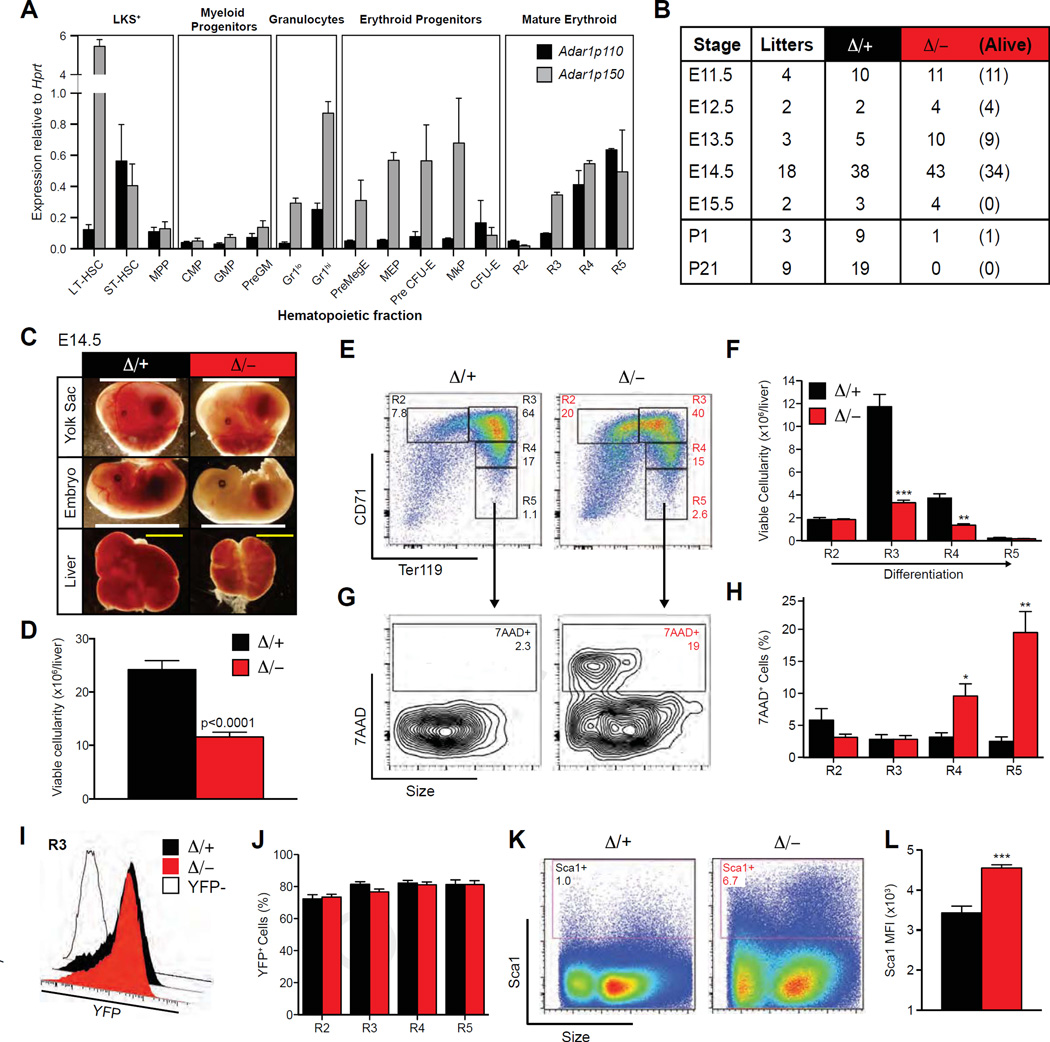
Figure 1.
Erythroid-specific deletion of Adar1 causes embryonic death. (A) qRT-PCR of Adar1p110 and Adar1p150 normalized to Hprt in purified hematopoietic fractions. (B) Survival of Epor-Adar1Δ/− (Δ/−) embryos. All Epor-Adar1Δ/+ (Δ/+) were viable at indicated time points. (C) Representative images at E14.5. Scale bar: Yolk sac/embryo proper = 1 cm; FL = 2 mm. (D–L) E14.5 FL of Δ/− and D/+. (D) Total viable cellularity. Representative FACS plots (E) and enumeration of erythroblast populations (F). Representative FACS plots of 7-AAD staining within R5 (G) and frequency in R2–R5 (H) erythroblasts. Representative histogram plots of eYFP expression within R3 (open histogram is eYFP control) (I) and frequencies of viable (7-AAD−) YFP+ erythrocytes (J). Representative FACS plots (K) and mean fluorescence intensity (MFI) (L) of Sca1 expression in unfractionated FL. Results are mean ± SEM (Δ/+ n = 14 and Δ/− n = 18). *p< 0.05, **p< 0.005, and ***p< 0.0005 compared with Δ/+.

