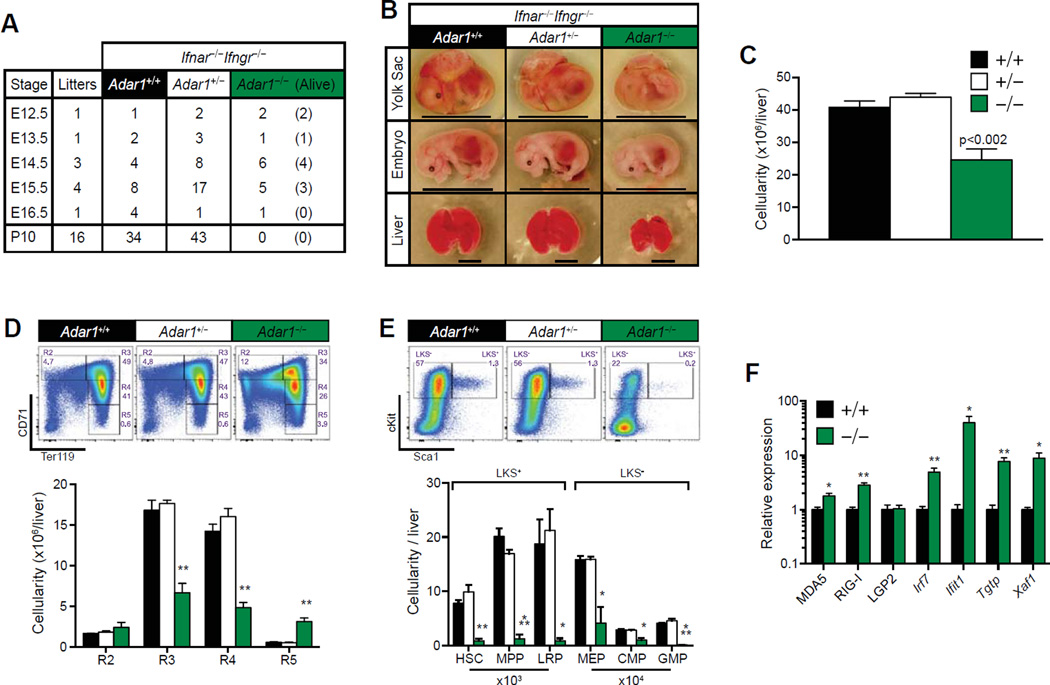
Figure 4.
Absence of IFN receptor signaling partially rescues Adar1−/− mice. (A) Survival table of Ifnar−/− Ifngr−/− Adar1−/− embryos. (B) Representative images at E15.5. Genotypes indicated. Scale bar: Yolk sac/embryo = 1 cm; FL = 4 mm. (C–E) FL analysis at E15.5. All embryos are Ifnar−/− Ifngr−/− and Adar1 genotype indicated. (C) Total viable (7-AAD) FL cellularity. Representative FACs plots (top) and enumeration (bottom) of (D) erythrocytes and (E) HSC, MPP, and lineage-restricted progenitors (LRP). Results are mean ± SEM (+/+ n = 8, +/− n = 17 and −/− n = 3). (F) qRT-PCR of ISGs from +/+ and −/− E14.5 FL. Expression was normalized to Hprt. Relative expression refers to fold change of −/− compared with +/+. Results are mean ± SEM (+/+ n = 4, +/− n = 8, and −/− n = 4). *p< 0.05, **p< 0.005, and ***p< 0.0005 compared with +/+.

