Figure 7.
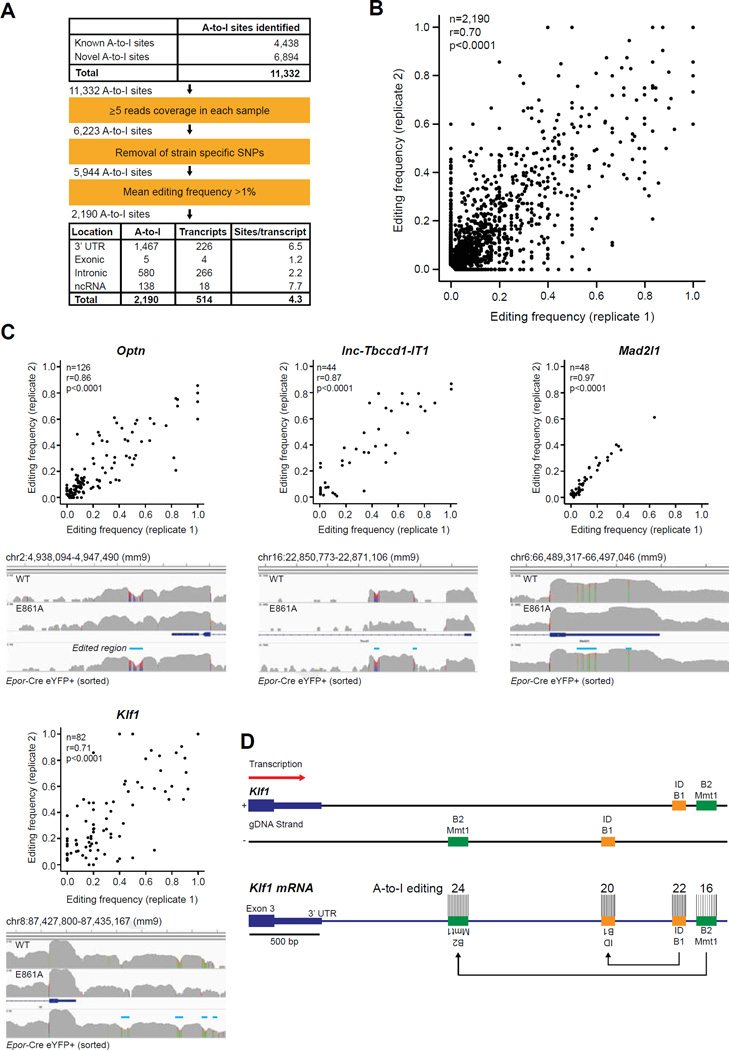
Novel editing sites within long UTRs of erythroid-specific transcripts. A-to-I (G mismatches in YFP+ cells isolated from two independent Epor-Adar1Δ/+ E14.5 FL. (A) Summary of A-to-I editing site analysis. (B) Scatter plot of 2190 high-confidence A-to-I editing frequencies from each replicate. (C) Scatter plots (top) and representative screenshots (bottom) of four transcripts with hyperedited 3′-UTRs (edited regions are indicated by blue line). See Supplementary Table E6 (online only, available at www.exphem.org) for other genes with hyperedited 3′-UTRs. n refers to the number of A-to-I sites within each gene. Correlations and statistics were determined by two-tailed Pearson correlation coefficients. (D) Scaled schematic representation of hyperedited clusters within the 3′-UTR of Klf1. Two tandem duplicated SINEs, ID_B1 (orange) and B2_Mmt1 (green), are located on opposite DNA strands downstream of the annotated Klf1 3′-UTR. The number of A-to-I editing sites within each SINE is depicted.

