
Figure 4. Comparison of proteins from samples grown with glucose, sucrose, or fructose versus all other carbon sources.
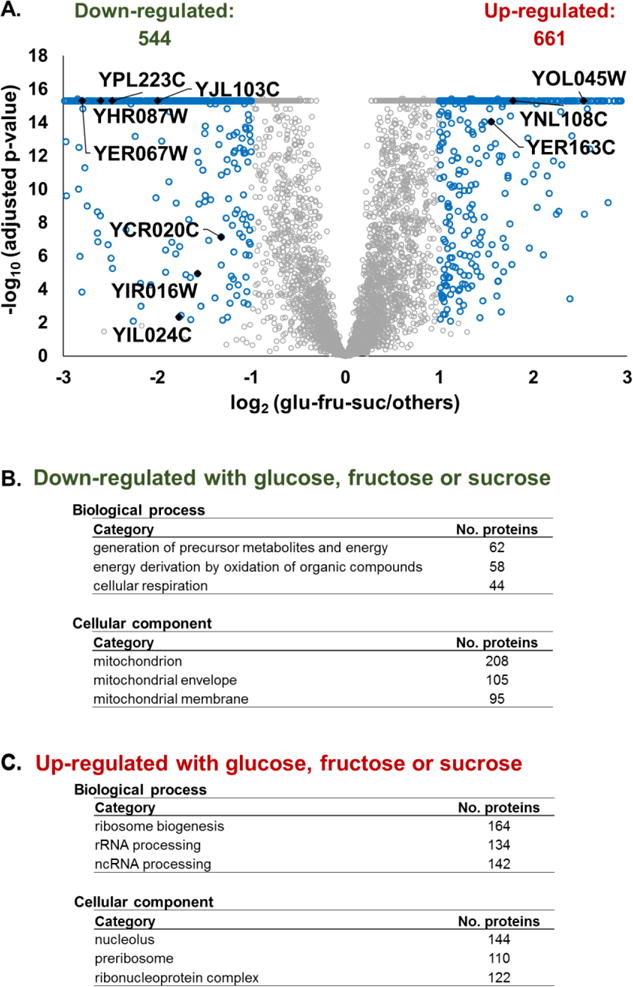
A) Volcano plot displaying the p-value and the log2 fold-change of the TMT signal-to-noise values of proteins from yeast grown in glucose, sucrose and fructose to that of the other carbon sources. Highlighted are proteins of unknown function with potential roles in metabolism. P-values were capped at 1E-16. Gene ontology terms for proteins that are B) down -regulated or C) up-regulated in yeast with glucose, sucrose or fructose as the carbon sources.