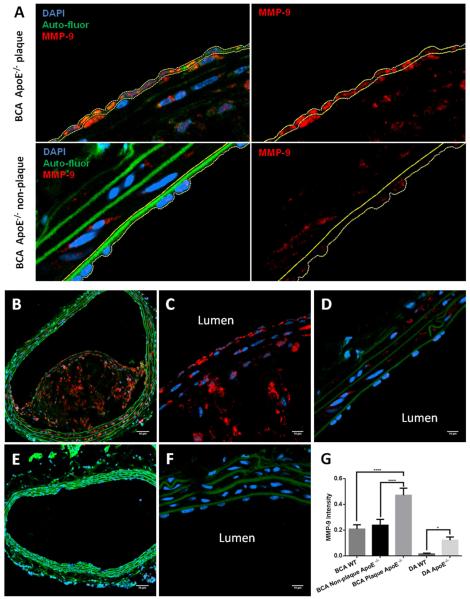
Fig. 6. MMP-9 staining in BCA sections.
(A) Selection of the region of interest (ROI) for MMP-9 quantification in the endothelial layer. ROI was traced (yellow line) in the merged image (left panels) and quantified in the red channel (MMP-9; right panels). Typical selection areas are shown for the plaque (top panels) and non-plaque (bottom panels) areas of the ApoE−/− BCA. (B) 20X image of BCA with plaque, obtained from a high fat fed ApoE−/− mouse. MMP-9 staining (red) is seen throughout the plaque. (C) 63X/oil image of MMP-9 stain in the plaque. (D) 63X/oil image of MMP-9 stain in the non-plaque region of diseased vessel. (E) 20X image of a healthy BCA without plaque, obtained from a normal diet fed wildtype mouse, shows little MMP-9 staining. (F) 63X/oil image of MMP-9 stain in healthy vessel. (G) Quantification of MMP-9 intensity within the ROI as shown in (A). Mean comparisons were performed using 1-way ANOVA with Tukey’s method to correct for multiple comparisons. N=33 for BCA samples; N=71 for DA WT; N=54 for DA ApoE−/−. ****p<0.0001, *p<0.05. Scale bar = 50 μm for B and E; scale bar = 10 μm for C-D, F.

