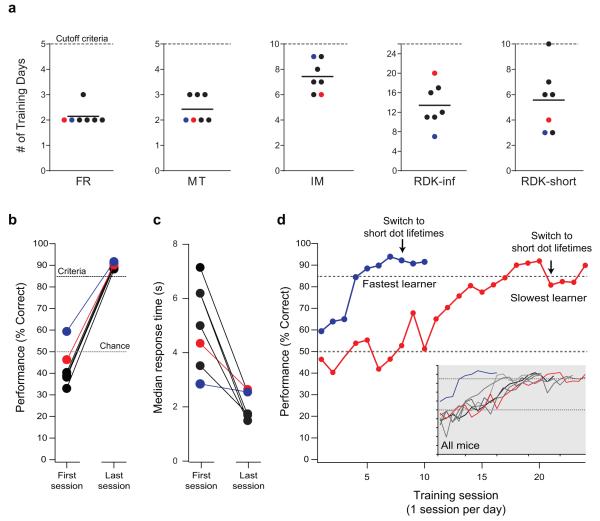
Figure 3. RDK discrimination learning.
(a) The number of training days for each mouse until performance criteria were met for progression to the next stage (solid line indicates the population mean). The “cutoff criteria” (dotted line) is the maximum number of training days allowed for a stage. (b) Initial and final performance during training on the RDK task. On the first day of training the mice were close to chance level (dotted line at 50%). After 10-24 days of training, all mice had acquired the task to the criteria level (dotted line at 85%). (c) The median response time (time from the presentation of the stimulus until the selection of a stimulus) for each animal on both the initial and final days of RDK training indicates that there is a significant decrease (p = 0.004, paired t-test) the in response time after the mice learned the task. (d) RDK training curves of the fastest (blue) and slowest (red) mice to reach the criteria. Acquisition of the RDK task occurred over 10-24 days of training (one training session per day). The arrow indicates the switch from infinite dot lifetime to finite dot lifetime. Due to the decrease in coherence level created by the change in dot lifetime, the performance of the mice decreased. In the inset, the RDK training curves for all mice showing performance across training sessions are shown. Criteria level (85%) and chance level (50%) are indicated. The tick marks on the inset plot have the same values as those shown on the larger plot.

