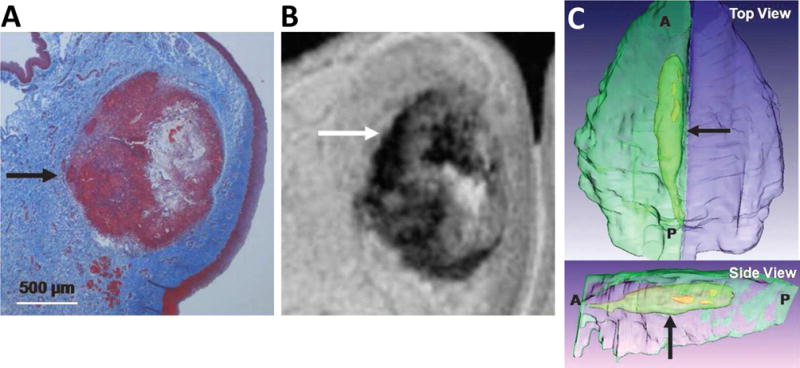
Figure 9.

Representative example of histology–magnetic resonance imaging matching (A: histology and B: MRI) that was used for 3-dimensional reconstruction of vocal fold with Amira software (C). Arrows show location of residual PEG30 and cellular infiltrate. A: anterior; P: posterior.[132] Reprint with permission from Karajanagi, S. S.; Lopez-Guerra, G.; Park, H.; et al. Ann. Otol. Rhinol. Laryngol. 2011, 120, 175. Copyright (2011) SAGE Publications.
