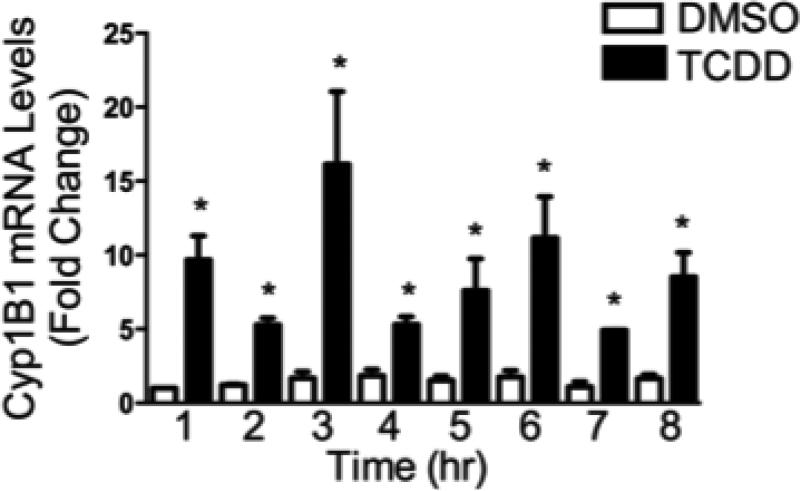
Figure 2.
Time-dependent induction of the Cyp1B1 gene expression by TCDD. The SKW-AHR+ cells (1×10⁶ cells/ml) were treated with 30 nM of TCDD or 0.02% DMSO (VH) for indicated periods of time. Total RNA was isolated, and steady-state Cyp1B1 mRNA levels were measured by TaqMan qRT-PCR and normalized to the endogenous 18S ribosomal RNA. Data are presented as fold change compared to the VH control group at corresponding time point. The data are representative of two separate experiments with three experimental replicates per group. Statistical significance was determined using a two-way ANOVA and Dunnett's two-tailed t test; * represents values that are significantly different from naive at p < 0.05.

