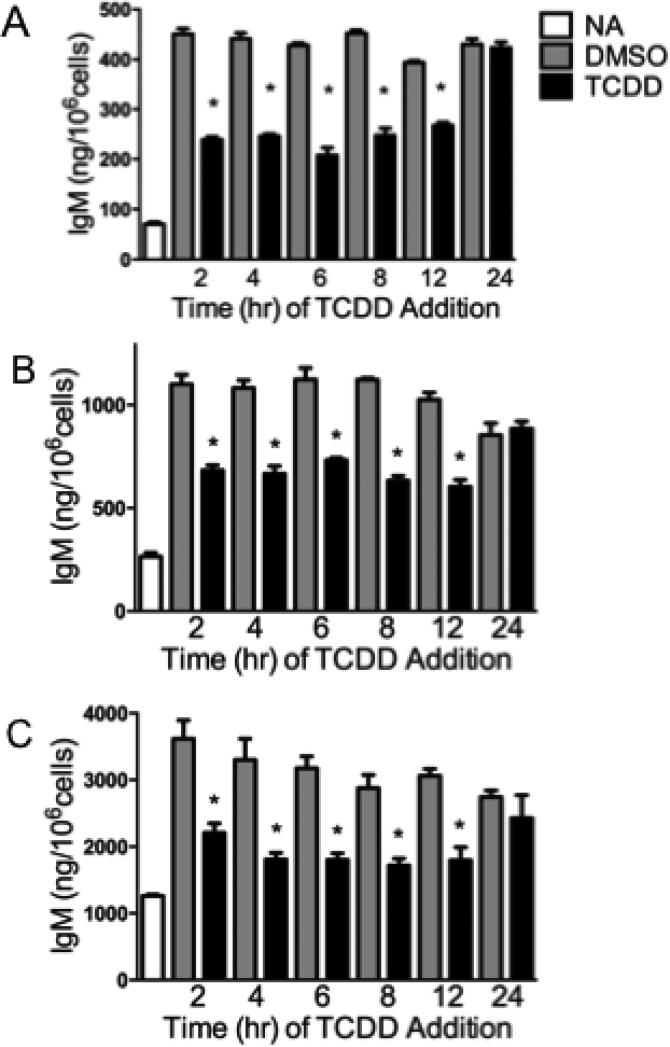
Figure 4.
Relationship between time of TCDD addition and in vitro IgM response. SKW-AHR+ (A), mouse (B) and rat (C) primary B cells were activated with PWM (150 μg/ml and 15 μg/ml respectively) and treated with 30 nM TCDD and/or vehicle (0.01% DMSO) at indicated time-points after activation. Supernatants were harvested at 120 h post PWM activation and the amount of secreted IgM was measured by sandwich ELISA. The data are representative of three separate experiments (one animal per experiment) with 4 experimental replicates per group. Statistical significance was determined using Dunnett's two-tailed t test; * represents values that are significantly different from naive at p < 0.05.

