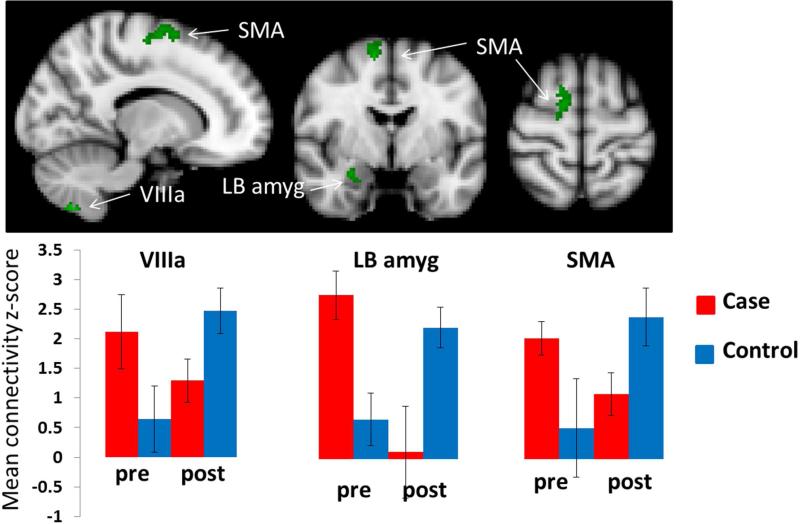
Figure 1.
Significant group-by-condition interaction effects from the right PAG seed region. Significant clusters are shown in green. The bar graphs in the lower panel show the basis of the interaction effect in the cerebellar, amygdala, and supplementary motor area (SMA) clusters. Bar graphs were created by extracting the average z-score and the standard deviation of the voxels within the significant interaction cluster before and after bladder distention for each cohort separately.

